
Turkey - Carboys, Bottles And Similar Articles Of Plastics - Market Analysis, Forecast, Size, Trends and Insights
Get instant access to more than 2 million reports, dashboards, and datasets on the IndexBox Platform.
View PricingExport of Plastic Bottles From Turkey Decreases Slightly to $13M in January 2024
Turkey Plastic Bottle Exports
In January 2024, shipments abroad of carboys, bottles and similar articles of plastics was finally on the rise to reach 7.1K tons for the first time since September 2023, thus ending a three-month declining trend. In general, exports, however, saw a relatively flat trend pattern. The most prominent rate of growth was recorded in March 2023 with an increase of 32% month-to-month.
In value terms, plastic bottle exports dropped to $13M (IndexBox estimates) in January 2024. Overall, exports, however, saw a relatively flat trend pattern. The most prominent rate of growth was recorded in March 2023 when exports increased by 35% month-to-month. As a result, the exports reached the peak of $19M. From April 2023 to January 2024, the growth of the exports remained at a somewhat lower figure.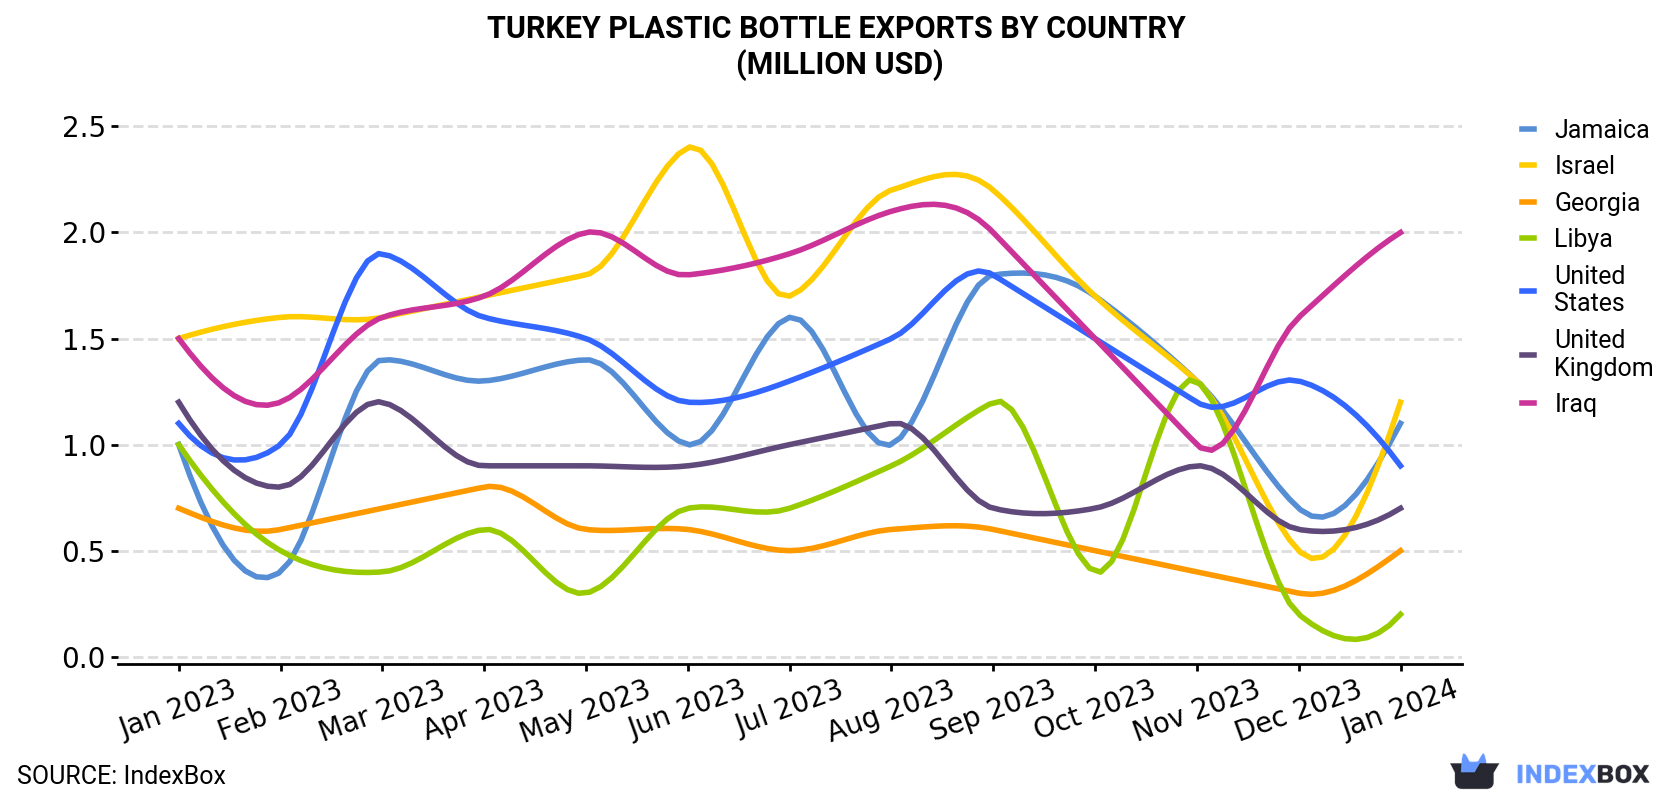
| COUNTRY | Export Value of Plastic Bottle in Turkey (million USD) | ||||||||||||
|---|---|---|---|---|---|---|---|---|---|---|---|---|---|
| Jan 2023 | Feb 2023 | Mar 2023 | Apr 2023 | May 2023 | Jun 2023 | Jul 2023 | Aug 2023 | Sep 2023 | Oct 2023 | Nov 2023 | Dec 2023 | Jan 2024 | |
| Iraq | 1.5 | 1.2 | 1.6 | 1.7 | 2.0 | 1.8 | 1.9 | 2.1 | 2.0 | 1.5 | 1.0 | 1.6 | 2.0 |
| Israel | 1.5 | 1.6 | 1.6 | 1.7 | 1.8 | 2.4 | 1.7 | 2.2 | 2.2 | 1.7 | 1.3 | 0.5 | 1.2 |
| Jamaica | 1.0 | 0.4 | 1.4 | 1.3 | 1.4 | 1.0 | 1.6 | 1.0 | 1.8 | 1.7 | 1.3 | 0.7 | 1.1 |
| United States | 1.1 | 1.0 | 1.9 | 1.6 | 1.5 | 1.2 | 1.3 | 1.5 | 1.8 | 1.5 | 1.2 | 1.3 | 0.9 |
| United Kingdom | 1.2 | 0.8 | 1.2 | 0.9 | 0.9 | 0.9 | 1.0 | 1.1 | 0.7 | 0.7 | 0.9 | 0.6 | 0.7 |
| Georgia | 0.7 | 0.6 | 0.7 | 0.8 | 0.6 | 0.6 | 0.5 | 0.6 | 0.6 | 0.5 | 0.4 | 0.3 | 0.5 |
| Libya | 1.0 | 0.5 | 0.4 | 0.6 | 0.3 | 0.7 | 0.7 | 0.9 | 1.2 | 0.4 | 1.3 | 0.2 | 0.2 |
| Others | 6.6 | 7.8 | 10.0 | 8.8 | 9.1 | 9.4 | 9.7 | 9.0 | 8.4 | 10.1 | 9.1 | 8.7 | 6.7 |
| Total | 14.7 | 14.0 | 18.8 | 17.3 | 17.5 | 18.0 | 18.3 | 18.6 | 18.8 | 18.0 | 16.5 | 13.8 | 13.3 |
Exports by Country
Iraq (1.3K tons), Jamaica (724 tons) and Israel (573 tons) were the main destinations of plastic bottle exports from Turkey, together comprising 37% of total exports.
From January 2023 to January 2024, the most notable rate of growth in terms of shipments, amongst the main countries of destination, was attained by Iraq (with a CAGR of +3.7%), while the other leaders experienced mixed trend patterns.
In value terms, the largest markets for plastic bottle exported from Turkey were Iraq ($2M), Israel ($1.2M) and Jamaica ($1.1M), with a combined 33% share of total exports.
Iraq, with a CAGR of +2.5%, recorded the highest rates of growth with regard to the value of exports, in terms of the main countries of destination over the period under review, while shipments for the other leaders experienced mixed trend patterns.
Export Prices by Country
In January 2024, the plastic bottle price amounted to $1,891 per ton (FOB, Turkey), dropping by -4.3% against the previous month. Over the period under review, the export price showed a relatively flat trend pattern. The growth pace was the most rapid in November 2023 an increase of 7.2% month-to-month. Over the period under review, the average export prices hit record highs at $2,036 per ton in April 2023; however, from May 2023 to January 2024, the export prices remained at a lower figure.
Prices varied noticeably by the country of destination: the country with the highest price was Romania ($3,674 per ton), while the average price for exports to Peru ($1,434 per ton) was amongst the lowest.
From January 2023 to January 2024, the most notable rate of growth in terms of prices was recorded for supplies to Romania (+2.4%), while the prices for the other major destinations experienced more modest paces of growth.
This report provides an in-depth analysis of the plastic bottle market in Turkey. Within it, you will discover the latest data on market trends and opportunities by country, consumption, production and price developments, as well as the global trade (imports and exports). The forecast exhibits the market prospects through 2030.
Product coverage:
- Prodcom 22221450 - Plastic carboys, bottles, flasks and similar articles for the conveyance or packing of goods, of a capacity . 2 litres
- Prodcom 22221470 - Plastic carboys, bottles, flasks and similar articles for the conveyance or packing of goods, of a capacity > 2 litres
Country coverage:
- Turkey
Data coverage:
- Market volume and value
- Per Capita consumption
- Forecast of the market dynamics in the medium term
- Trade (exports and imports) in Turkey
- Export and import prices
- Market trends, drivers and restraints
- Key market players and their profiles
Reasons to buy this report:
- Take advantage of the latest data
- Find deeper insights into current market developments
- Discover vital success factors affecting the market
This report is designed for manufacturers, distributors, importers, and wholesalers, as well as for investors, consultants and advisors.
In this report, you can find information that helps you to make informed decisions on the following issues:
- How to diversify your business and benefit from new market opportunities
- How to load your idle production capacity
- How to boost your sales on overseas markets
- How to increase your profit margins
- How to make your supply chain more sustainable
- How to reduce your production and supply chain costs
- How to outsource production to other countries
- How to prepare your business for global expansion
While doing this research, we combine the accumulated expertise of our analysts and the capabilities of artificial intelligence. The AI-based platform, developed by our data scientists, constitutes the key working tool for business analysts, empowering them to discover deep insights and ideas from the marketing data.
-
1. INTRODUCTION
Making Data-Driven Decisions to Grow Your Business
- REPORT DESCRIPTION
- RESEARCH METHODOLOGY AND AI PLATFORM
- DATA-DRIVEN DECISIONS FOR YOUR BUSINESS
- GLOSSARY AND SPECIFIC TERMS
-
2. EXECUTIVE SUMMARY
A Quick Overview of Market Performance
- KEY FINDINGS
- MARKET TRENDS This Chapter is Available Only for the Professional Edition PRO
-
3. MARKET OVERVIEW
Understanding the Current State of The Market and Its Prospects
- MARKET SIZE
- MARKET STRUCTURE
- TRADE BALANCE
- PER CAPITA CONSUMPTION
- MARKET FORECAST TO 2030
-
4. MOST PROMISING PRODUCT
Finding New Products to Diversify Your Business
This Chapter is Available Only for the Professional Edition PRO- TOP PRODUCTS TO DIVERSIFY YOUR BUSINESS
- BEST-SELLING PRODUCTS
- MOST CONSUMED PRODUCT
- MOST TRADED PRODUCT
- MOST PROFITABLE PRODUCT FOR EXPORT
-
5. MOST PROMISING SUPPLYING COUNTRIES
Choosing the Best Countries to Establish Your Sustainable Supply Chain
This Chapter is Available Only for the Professional Edition PRO- TOP COUNTRIES TO SOURCE YOUR PRODUCT
- TOP PRODUCING COUNTRIES
- TOP EXPORTING COUNTRIES
- LOW-COST EXPORTING COUNTRIES
-
6. MOST PROMISING OVERSEAS MARKETS
Choosing the Best Countries to Boost Your Exports
This Chapter is Available Only for the Professional Edition PRO- TOP OVERSEAS MARKETS FOR EXPORTING YOUR PRODUCT
- TOP CONSUMING MARKETS
- UNSATURATED MARKETS
- TOP IMPORTING MARKETS
- MOST PROFITABLE MARKETS
7. PRODUCTION
The Latest Trends and Insights into The Industry
- PRODUCTION VOLUME AND VALUE
8. IMPORTS
The Largest Import Supplying Countries
- IMPORTS FROM 2012–2023
- IMPORTS BY COUNTRY
- IMPORT PRICES BY COUNTRY
9. EXPORTS
The Largest Destinations for Exports
- EXPORTS FROM 2012–2023
- EXPORTS BY COUNTRY
- EXPORT PRICES BY COUNTRY
-
10. PROFILES OF MAJOR PRODUCERS
The Largest Producers on The Market and Their Profiles
This Chapter is Available Only for the Professional Edition PRO -
LIST OF TABLES
- Key Findings In 2023
- Market Volume, In Physical Terms, 2012–2023
- Market Value, 2012–2023
- Per Capita Consumption In 2012-2023
- Imports, In Physical Terms, By Country, 2012–2023
- Imports, In Value Terms, By Country, 2012–2023
- Import Prices, By Country Of Origin, 2012–2023
- Exports, In Physical Terms, By Country, 2012–2023
- Exports, In Value Terms, By Country, 2012–2023
- Export Prices, By Country Of Destination, 2012–2023
-
LIST OF FIGURES
- Market Volume, In Physical Terms, 2012–2023
- Market Value, 2012–2023
- Market Structure – Domestic Supply vs. Imports, In Physical Terms, 2012-2023
- Market Structure – Domestic Supply vs. Imports, In Value Terms, 2012-2023
- Trade Balance, In Physical Terms, 2012-2023
- Trade Balance, In Value Terms, 2012-2023
- Per Capita Consumption, 2012-2023
- Market Volume Forecast to 2030
- Market Value Forecast to 2030
- Products: Market Size And Growth, By Type
- Products: Average Per Capita Consumption, By Type
- Products: Exports And Growth, By Type
- Products: Export Prices And Growth, By Type
- Production Volume And Growth
- Exports And Growth
- Export Prices And Growth
- Market Size And Growth
- Per Capita Consumption
- Imports And Growth
- Import Prices
- Production, In Physical Terms, 2012–2023
- Production, In Value Terms, 2012–2023
- Imports, In Physical Terms, 2012–2023
- Imports, In Value Terms, 2012–2023
- Imports, In Physical Terms, By Country, 2023
- Imports, In Physical Terms, By Country, 2012–2023
- Imports, In Value Terms, By Country, 2012–2023
- Import Prices, By Country Of Origin, 2012–2023
- Exports, In Physical Terms, 2012–2023
- Exports, In Value Terms, 2012–2023
- Exports, In Physical Terms, By Country, 2023
- Exports, In Physical Terms, By Country, 2012–2023
- Exports, In Value Terms, By Country, 2012–2023
- Export Prices, By Country Of Destination, 2012–2023


