Turkey - Woven Fabrics Of Cotton - Market Analysis, Forecast, Size, Trends and Insights
Get instant access to more than 2 million reports, dashboards, and datasets on the IndexBox Platform.
View PricingTurkey's Cotton Textile Export Experiences a 4% Decrease, Totaling $69M in November 2023.
Turkey Cotton Fabric Exports
In November 2023, exports of woven fabrics of cotton from Turkey was estimated at 48M square meters, almost unchanged from the previous month. Over the period under review, exports saw a relatively flat trend pattern. The pace of growth appeared the most rapid in September 2023 with an increase of 36% month-to-month. As a result, the exports attained the peak of 57M square meters. From October 2023 to November 2023, the growth of the exports failed to regain momentum.
In value terms, cotton fabric exports shrank modestly to $69M (IndexBox estimates) in November 2023. In general, exports, however, saw a relatively flat trend pattern. The most prominent rate of growth was recorded in September 2023 when exports increased by 38% m-o-m. As a result, the exports attained the peak of $85M. From October 2023 to November 2023, the growth of the exports remained at a lower figure.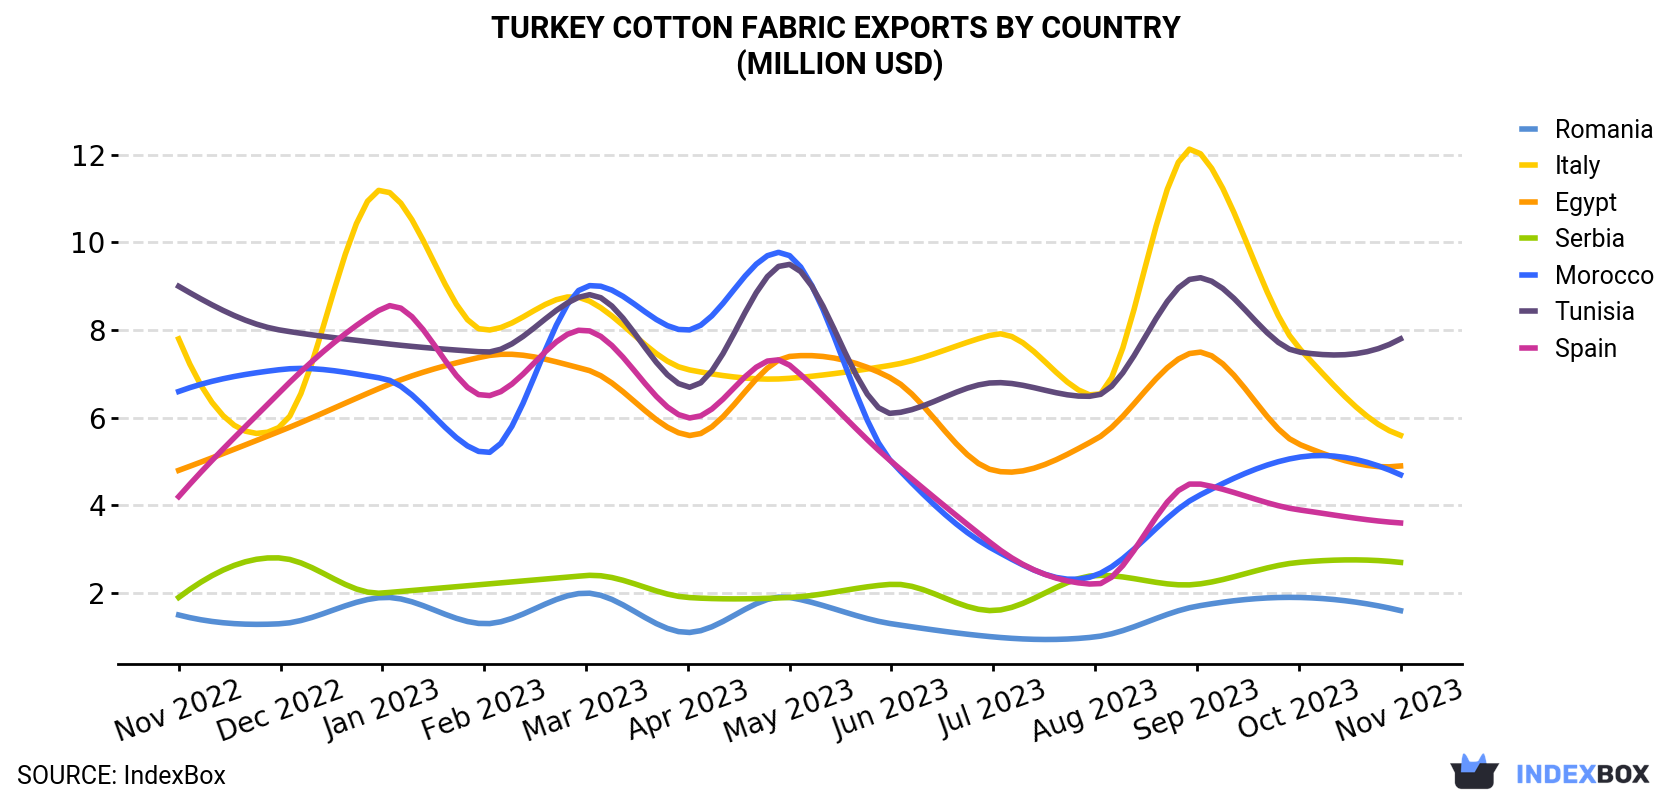
| COUNTRY | Export Value of Cotton Fabric in Turkey (million USD) | ||||||||||||
|---|---|---|---|---|---|---|---|---|---|---|---|---|---|
| Nov 2022 | Dec 2022 | Jan 2023 | Feb 2023 | Mar 2023 | Apr 2023 | May 2023 | Jun 2023 | Jul 2023 | Aug 2023 | Sep 2023 | Oct 2023 | Nov 2023 | |
| Tunisia | 9.0 | 8.0 | 7.7 | 7.5 | 8.8 | 6.7 | 9.5 | 6.1 | 6.8 | 6.5 | 9.2 | 7.5 | 7.8 |
| Italy | 7.8 | 5.8 | 11.2 | 8.0 | 8.7 | 7.1 | 6.9 | 7.2 | 7.9 | 6.5 | 12.1 | 7.6 | 5.6 |
| Egypt | 4.8 | 5.7 | 6.7 | 7.4 | 7.1 | 5.6 | 7.4 | 6.9 | 4.8 | 5.5 | 7.5 | 5.4 | 4.9 |
| Morocco | 6.6 | 7.1 | 6.9 | 5.2 | 9.0 | 8.0 | 9.7 | 5.0 | 3.0 | 2.4 | 4.2 | 5.1 | 4.7 |
| Spain | 4.2 | 6.6 | 8.5 | 6.5 | 8.0 | 6.0 | 7.2 | 5.0 | 3.1 | 2.2 | 4.5 | 3.9 | 3.6 |
| Serbia | 1.9 | 2.8 | 2.0 | 2.2 | 2.4 | 1.9 | 1.9 | 2.2 | 1.6 | 2.4 | 2.2 | 2.7 | 2.7 |
| Romania | 1.5 | 1.3 | 1.9 | 1.3 | 2.0 | 1.1 | 1.9 | 1.3 | 1.0 | 1.0 | 1.7 | 1.9 | 1.6 |
| Others | 38.7 | 33.4 | 31.3 | 28.9 | 36.1 | 31.7 | 37.4 | 33.9 | 26.9 | 34.7 | 43.2 | 38.1 | 38.1 |
| Total | 74.5 | 70.8 | 76.2 | 66.9 | 82.2 | 68.1 | 81.9 | 67.6 | 55.1 | 61.3 | 84.6 | 72.0 | 68.9 |
Exports by Country
Italy (4.9M square meters), Tunisia (4.1M square meters) and Egypt (3M square meters) were the main destinations of cotton fabric exports from Turkey, together comprising 25% of total exports. Spain, Morocco, Serbia and Romania lagged somewhat behind, together comprising a further 17%.
From November 2022 to November 2023, the biggest increases were in Serbia (with a CAGR of +3.2%), while shipments for the other leaders experienced more modest paces of growth.
In value terms, the largest markets for cotton fabric exported from Turkey were Tunisia ($7.8M), Italy ($5.6M) and Egypt ($4.9M), with a combined 27% share of total exports. These countries were followed by Morocco, Spain, Serbia and Romania, which together accounted for a further 18%.
In terms of the main countries of destination, Serbia, with a CAGR of +3.0%, recorded the highest growth rate of the value of exports, over the period under review, while shipments for the other leaders experienced more modest paces of growth.
Exports by Type
Woven fabrics of cotton, containing 85% or more by weight of cotton, weighing not more than 200 g/m2 (22M square meters), woven fabrics of cotton, containing 85% or more by weight of cotton, weighing more than 200g/m2 (19M square meters) and woven fabrics of cotton, containing less than 85% by weight of cotton, mixed mainly or solely with man-made fibres, weighing not more than 200 g/m2 (4.4M square meters) were the main products of cotton fabric exports from Turkey, together accounting for 93% of total exports.
From November 2022 to November 2023, the most notable rate of growth in terms of shipments, amongst the major product types, was attained by woven fabrics of cotton, containing less than 85% by weight of cotton, mixed mainly or solely with man-made fibres, weighing not more than 200 g/m2 (with a CAGR of +2.1%), while the other products experienced more modest paces of growth.
In value terms, woven fabrics of cotton, containing 85% or more by weight of cotton, weighing more than 200g/m2 ($30M), woven fabrics of cotton, containing 85% or more by weight of cotton, weighing not more than 200 g/m2 ($20M) and woven fabrics of cotton, containing less than 85% by weight of cotton, mixed mainly or solely with man-made fibres, weighing more than 200g/m2 ($11M) constituted the most exported types of woven fabrics of cotton from Turkey worldwide, with a combined 87% share of total exports. Woven fabrics of cotton, containing less than 85% by weight of cotton, mixed mainly or solely with man-made fibres, weighing not more than 200 g/m2 and other woven fabrics of cotton, n.e.s. in chapter 52 lagged somewhat behind, together comprising a further 13%.
In terms of the main product categories, woven fabrics of cotton, containing less than 85% by weight of cotton, mixed mainly or solely with man-made fibres, weighing not more than 200 g/m2, with a CAGR of +1.5%, saw the highest growth rate of the value of exports, over the period under review, while shipments for the other products experienced a decline.
Export Prices by Country
In November 2023, the cotton fabric price stood at $1.4 per square meter (FOB, Turkey), waning by -4.6% against the previous month. In general, the export price showed a slight decline. The most prominent rate of growth was recorded in December 2022 when the average export price increased by 4.6% against the previous month. As a result, the export price reached the peak level of $1,699 per thousand square meters. From January 2023 to November 2023, the the average export prices failed to regain momentum.
There were significant differences in the average prices for the major export markets. In November 2023, the country with the highest price was Bangladesh ($2.1 per square meter), while the average price for exports to Belgium ($526 per thousand square meters) was amongst the lowest.
From November 2022 to November 2023, the most notable rate of growth in terms of prices was recorded for supplies to Bulgaria (+1.4%), while the prices for the other major destinations experienced more modest paces of growth.
This report provides an in-depth analysis of the cotton fabric market in Turkey. Within it, you will discover the latest data on market trends and opportunities by country, consumption, production and price developments, as well as the global trade (imports and exports). The forecast exhibits the market prospects through 2030.
Product coverage:
- Prodcom 13202020 - Woven fabrics of cotton weighing . .100 g/m., for medical gauzes, bandages and dressings
- Prodcom 13202060 - Woven fabrics of denim cotton weighing > .200 g/m. (including denim other than blue)
- Prodcom 132020Z1 - Cotton fabrics, . .200 g/m. (excluding gauze and coloured yarns)
- Prodcom 132020Z2 - Cotton fabrics, > .200 g/m. (excluding coloured yarns)
- Prodcom 132020Z3 - Woven fabrics of cotton of yarns of different colours (excluding denim)
Country coverage:
- Turkey
Data coverage:
- Market volume and value
- Per Capita consumption
- Forecast of the market dynamics in the medium term
- Trade (exports and imports) in Turkey
- Export and import prices
- Market trends, drivers and restraints
- Key market players and their profiles
Reasons to buy this report:
- Take advantage of the latest data
- Find deeper insights into current market developments
- Discover vital success factors affecting the market
This report is designed for manufacturers, distributors, importers, and wholesalers, as well as for investors, consultants and advisors.
In this report, you can find information that helps you to make informed decisions on the following issues:
- How to diversify your business and benefit from new market opportunities
- How to load your idle production capacity
- How to boost your sales on overseas markets
- How to increase your profit margins
- How to make your supply chain more sustainable
- How to reduce your production and supply chain costs
- How to outsource production to other countries
- How to prepare your business for global expansion
While doing this research, we combine the accumulated expertise of our analysts and the capabilities of artificial intelligence. The AI-based platform, developed by our data scientists, constitutes the key working tool for business analysts, empowering them to discover deep insights and ideas from the marketing data.
-
1. INTRODUCTION
Making Data-Driven Decisions to Grow Your Business
- REPORT DESCRIPTION
- RESEARCH METHODOLOGY AND AI PLATFORM
- DATA-DRIVEN DECISIONS FOR YOUR BUSINESS
- GLOSSARY AND SPECIFIC TERMS
-
2. EXECUTIVE SUMMARY
A Quick Overview of Market Performance
- KEY FINDINGS
- MARKET TRENDS This Chapter is Available Only for the Professional Edition PRO
-
3. MARKET OVERVIEW
Understanding the Current State of The Market and Its Prospects
- MARKET SIZE
- MARKET STRUCTURE
- TRADE BALANCE
- PER CAPITA CONSUMPTION
- MARKET FORECAST TO 2030
-
4. MOST PROMISING PRODUCT
Finding New Products to Diversify Your Business
This Chapter is Available Only for the Professional Edition PRO- TOP PRODUCTS TO DIVERSIFY YOUR BUSINESS
- BEST-SELLING PRODUCTS
- MOST CONSUMED PRODUCT
- MOST TRADED PRODUCT
- MOST PROFITABLE PRODUCT FOR EXPORT
-
5. MOST PROMISING SUPPLYING COUNTRIES
Choosing the Best Countries to Establish Your Sustainable Supply Chain
This Chapter is Available Only for the Professional Edition PRO- TOP COUNTRIES TO SOURCE YOUR PRODUCT
- TOP PRODUCING COUNTRIES
- TOP EXPORTING COUNTRIES
- LOW-COST EXPORTING COUNTRIES
-
6. MOST PROMISING OVERSEAS MARKETS
Choosing the Best Countries to Boost Your Exports
This Chapter is Available Only for the Professional Edition PRO- TOP OVERSEAS MARKETS FOR EXPORTING YOUR PRODUCT
- TOP CONSUMING MARKETS
- UNSATURATED MARKETS
- TOP IMPORTING MARKETS
- MOST PROFITABLE MARKETS
7. PRODUCTION
The Latest Trends and Insights into The Industry
- PRODUCTION VOLUME AND VALUE
8. IMPORTS
The Largest Import Supplying Countries
- IMPORTS FROM 2012–2023
- IMPORTS BY COUNTRY
- IMPORT PRICES BY COUNTRY
9. EXPORTS
The Largest Destinations for Exports
- EXPORTS FROM 2012–2023
- EXPORTS BY COUNTRY
- EXPORT PRICES BY COUNTRY
-
10. PROFILES OF MAJOR PRODUCERS
The Largest Producers on The Market and Their Profiles
This Chapter is Available Only for the Professional Edition PRO -
LIST OF TABLES
- Key Findings In 2023
- Market Volume, In Physical Terms, 2012–2023
- Market Value, 2012–2023
- Per Capita Consumption In 2012-2023
- Imports, In Physical Terms, By Country, 2012–2023
- Imports, In Value Terms, By Country, 2012–2023
- Import Prices, By Country Of Origin, 2012–2023
- Exports, In Physical Terms, By Country, 2012–2023
- Exports, In Value Terms, By Country, 2012–2023
- Export Prices, By Country Of Destination, 2012–2023
-
LIST OF FIGURES
- Market Volume, In Physical Terms, 2012–2023
- Market Value, 2012–2023
- Market Structure – Domestic Supply vs. Imports, In Physical Terms, 2012-2023
- Market Structure – Domestic Supply vs. Imports, In Value Terms, 2012-2023
- Trade Balance, In Physical Terms, 2012-2023
- Trade Balance, In Value Terms, 2012-2023
- Per Capita Consumption, 2012-2023
- Market Volume Forecast to 2030
- Market Value Forecast to 2030
- Products: Market Size And Growth, By Type
- Products: Average Per Capita Consumption, By Type
- Products: Exports And Growth, By Type
- Products: Export Prices And Growth, By Type
- Production Volume And Growth
- Exports And Growth
- Export Prices And Growth
- Market Size And Growth
- Per Capita Consumption
- Imports And Growth
- Import Prices
- Production, In Physical Terms, 2012–2023
- Production, In Value Terms, 2012–2023
- Imports, In Physical Terms, 2012–2023
- Imports, In Value Terms, 2012–2023
- Imports, In Physical Terms, By Country, 2023
- Imports, In Physical Terms, By Country, 2012–2023
- Imports, In Value Terms, By Country, 2012–2023
- Import Prices, By Country Of Origin, 2012–2023
- Exports, In Physical Terms, 2012–2023
- Exports, In Value Terms, 2012–2023
- Exports, In Physical Terms, By Country, 2023
- Exports, In Physical Terms, By Country, 2012–2023
- Exports, In Value Terms, By Country, 2012–2023
- Export Prices, By Country Of Destination, 2012–2023


