
South Africa - Platinum - Market Analysis, Forecast, Size, Trends And Insights
Get instant access to more than 2 million reports, dashboards, and datasets on the IndexBox Platform.
View PricingPlatinum Price Skyrockets to $33.7K per kg in South Africa
South Africa Platinum Export Price in May 2023
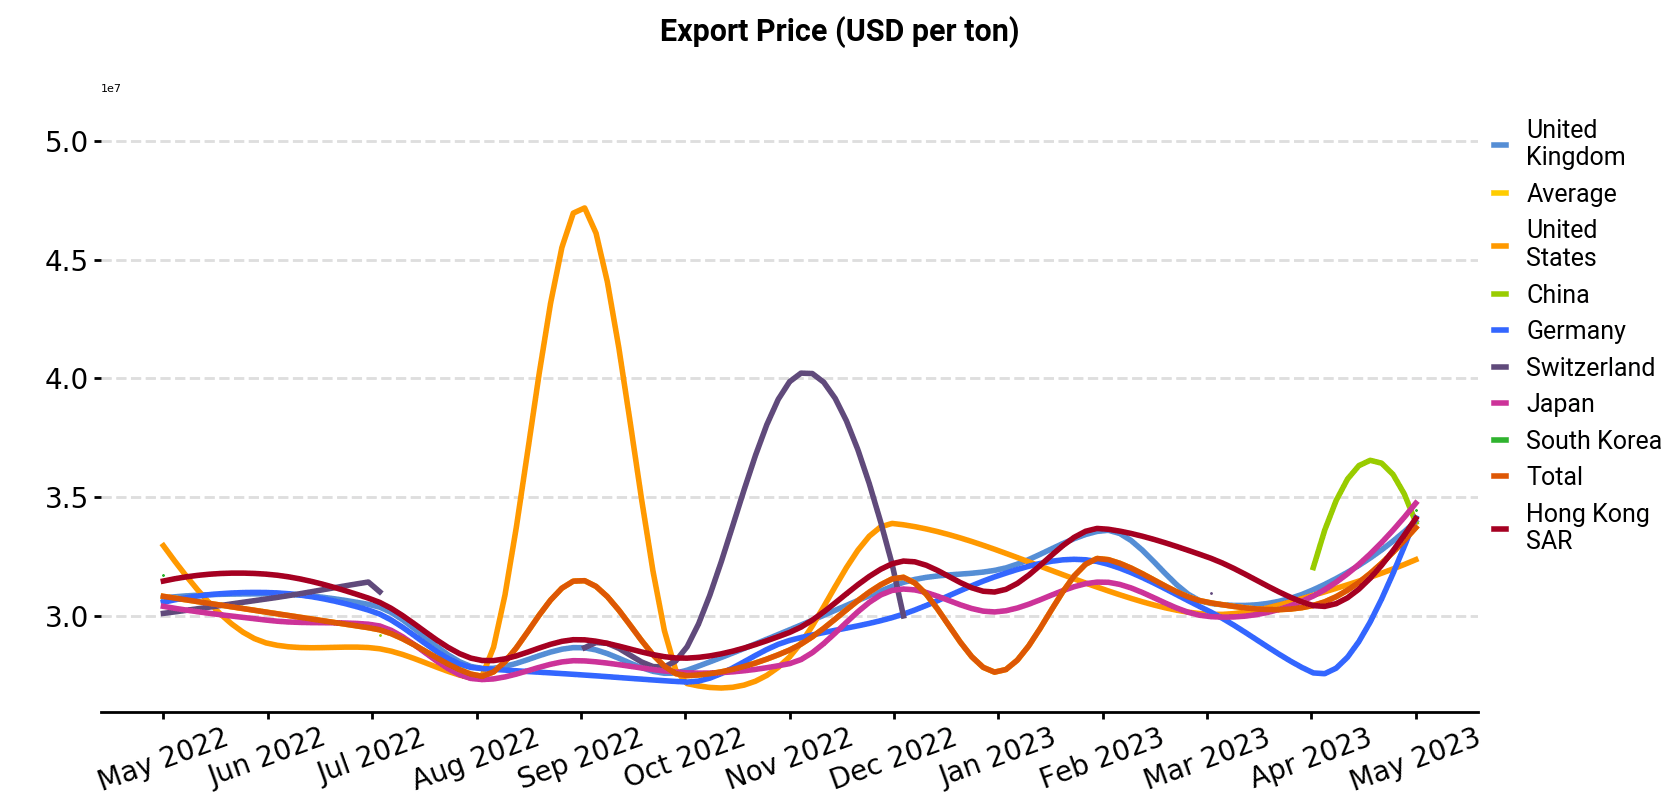
In May 2023, the platinum price stood at $33.7M per ton (FOB, South Africa), increasing by 11% against the previous month. Over the period under review, the export price saw a relatively flat trend pattern. The growth pace was the most rapid in February 2023 when the average export price increased by 17% m-o-m. The export price peaked in May 2023.
Average prices varied noticeably for the major export markets. In May 2023, the highest price was recorded for prices to Japan ($34.7M per ton) and South Korea ($34.5M per ton), while the average price for exports to the United States ($32.4M per ton) and China ($33.9M per ton) were amongst the lowest.
From May 2022 to May 2023, the most notable rate of growth in terms of prices was recorded for supplies to China (+1.4%), while the prices for the other major destinations experienced more modest paces of growth.
South Africa Platinum Exports
Platinum exports from South Africa skyrocketed to 12 tons in May 2023, jumping by 19% on the previous month's figure. Overall, exports recorded a relatively flat trend pattern. The pace of growth appeared the most rapid in March 2023 when exports increased by 44% m-o-m. The exports peaked in May 2023.
In value terms, platinum exports soared to $396M (IndexBox estimates) in May 2023. In general, exports continue to indicate a modest increase. The growth pace was the most rapid in March 2023 with an increase of 36% against the previous month. The exports peaked in May 2023.
South Africa Platinum Exports by Country
The UK (4.5 tons), Japan (3.1 tons) and the United States (1.6 tons) were the main destinations of platinum exports from South Africa, together comprising 79% of total exports. Germany, China, Hong Kong and South Korea lagged somewhat behind, together accounting for a further 20%.
From May 2022 to May 2023, the biggest increases were in South Korea (with a CAGR of +13.9%), while shipments for the other leaders experienced more modest paces of growth.
In value terms, the UK ($152M), Japan ($109M) and the United States ($53M) appeared to be the largest markets for platinum exported from South Africa worldwide, together accounting for 79% of total exports. Germany, China, Hong Kong and South Korea lagged somewhat behind, together accounting for a further 20%.
South Korea, with a CAGR of +14.7%, recorded the highest rates of growth with regard to the value of exports, among the main countries of destination over the period under review, while shipments for the other leaders experienced more modest paces of growth.
This report provides an in-depth analysis of the platinum market in South Africa. Within it, you will discover the latest data on market trends and opportunities by country, consumption, production and price developments, as well as the global trade (imports and exports). The forecast exhibits the market prospects through 2030.
Product coverage:
- Prodcom 24413010 -
- Prodcom 24413015 -
- Prodcom 24413020 -
- Prodcom 24413025 -
- Prodcom 24413040 -
- Prodcom 24413045 -
- Prodcom 24413055 -
- Prodcom 24413060 -
- Prodcom 24413065 -
- Prodcom 24413070 - Platinum catalysts in the form of wire cloth or grill
- Prodcom 24413030 - Platinum, palladium, rhodium, iridium, osmium and ruthenium, unwrought or in powder form
- Prodcom 24413050 - Platinum, palladium, rhodium, iridium, osmium and ruthenium, in semi-manufactured forms (excluding unwrought or in powder form)
Country coverage:
- South Africa
Data coverage:
- Market volume and value
- Per Capita consumption
- Forecast of the market dynamics in the medium term
- Trade (exports and imports) in South Africa
- Export and import prices
- Market trends, drivers and restraints
- Key market players and their profiles
Reasons to buy this report:
- Take advantage of the latest data
- Find deeper insights into current market developments
- Discover vital success factors affecting the market
This report is designed for manufacturers, distributors, importers, and wholesalers, as well as for investors, consultants and advisors.
In this report, you can find information that helps you to make informed decisions on the following issues:
- How to diversify your business and benefit from new market opportunities
- How to load your idle production capacity
- How to boost your sales on overseas markets
- How to increase your profit margins
- How to make your supply chain more sustainable
- How to reduce your production and supply chain costs
- How to outsource production to other countries
- How to prepare your business for global expansion
While doing this research, we combine the accumulated expertise of our analysts and the capabilities of artificial intelligence. The AI-based platform, developed by our data scientists, constitutes the key working tool for business analysts, empowering them to discover deep insights and ideas from the marketing data.
-
1. INTRODUCTION
Making Data-Driven Decisions to Grow Your Business
- REPORT DESCRIPTION
- RESEARCH METHODOLOGY AND AI PLATFORM
- DATA-DRIVEN DECISIONS FOR YOUR BUSINESS
- GLOSSARY AND SPECIFIC TERMS
-
2. EXECUTIVE SUMMARY
A Quick Overview of Market Performance
- KEY FINDINGS
- MARKET TRENDS This Chapter is Available Only for the Professional Edition PRO
-
3. MARKET OVERVIEW
Understanding the Current State of The Market and Its Prospects
- MARKET SIZE
- MARKET STRUCTURE
- TRADE BALANCE
- PER CAPITA CONSUMPTION
- MARKET FORECAST TO 2030
-
4. MOST PROMISING PRODUCT
Finding New Products to Diversify Your Business
This Chapter is Available Only for the Professional Edition PRO- TOP PRODUCTS TO DIVERSIFY YOUR BUSINESS
- BEST-SELLING PRODUCTS
- MOST CONSUMED PRODUCT
- MOST TRADED PRODUCT
- MOST PROFITABLE PRODUCT FOR EXPORT
-
5. MOST PROMISING SUPPLYING COUNTRIES
Choosing the Best Countries to Establish Your Sustainable Supply Chain
This Chapter is Available Only for the Professional Edition PRO- TOP COUNTRIES TO SOURCE YOUR PRODUCT
- TOP PRODUCING COUNTRIES
- TOP EXPORTING COUNTRIES
- LOW-COST EXPORTING COUNTRIES
-
6. MOST PROMISING OVERSEAS MARKETS
Choosing the Best Countries to Boost Your Exports
This Chapter is Available Only for the Professional Edition PRO- TOP OVERSEAS MARKETS FOR EXPORTING YOUR PRODUCT
- TOP CONSUMING MARKETS
- UNSATURATED MARKETS
- TOP IMPORTING MARKETS
- MOST PROFITABLE MARKETS
7. PRODUCTION
The Latest Trends and Insights into The Industry
- PRODUCTION VOLUME AND VALUE
8. IMPORTS
The Largest Import Supplying Countries
- IMPORTS FROM 2012–2023
- IMPORTS BY COUNTRY
- IMPORT PRICES BY COUNTRY
9. EXPORTS
The Largest Destinations for Exports
- EXPORTS FROM 2012–2023
- EXPORTS BY COUNTRY
- EXPORT PRICES BY COUNTRY
-
10. PROFILES OF MAJOR PRODUCERS
The Largest Producers on The Market and Their Profiles
This Chapter is Available Only for the Professional Edition PRO -
LIST OF TABLES
- Key Findings In 2023
- Market Volume, In Physical Terms, 2012–2023
- Market Value, 2012–2023
- Per Capita Consumption In 2012-2023
- Imports, In Physical Terms, By Country, 2012–2023
- Imports, In Value Terms, By Country, 2012–2023
- Import Prices, By Country Of Origin, 2012–2023
- Exports, In Physical Terms, By Country, 2012–2023
- Exports, In Value Terms, By Country, 2012–2023
- Export Prices, By Country Of Destination, 2012–2023
-
LIST OF FIGURES
- Market Volume, In Physical Terms, 2012–2023
- Market Value, 2012–2023
- Market Structure – Domestic Supply vs. Imports, In Physical Terms, 2012-2023
- Market Structure – Domestic Supply vs. Imports, In Value Terms, 2012-2023
- Trade Balance, In Physical Terms, 2012-2023
- Trade Balance, In Value Terms, 2012-2023
- Per Capita Consumption, 2012-2023
- Market Volume Forecast to 2030
- Market Value Forecast to 2030
- Products: Market Size And Growth, By Type
- Products: Average Per Capita Consumption, By Type
- Products: Exports And Growth, By Type
- Products: Export Prices And Growth, By Type
- Production Volume And Growth
- Exports And Growth
- Export Prices And Growth
- Market Size And Growth
- Per Capita Consumption
- Imports And Growth
- Import Prices
- Production, In Physical Terms, 2012–2023
- Production, In Value Terms, 2012–2023
- Imports, In Physical Terms, 2012–2023
- Imports, In Value Terms, 2012–2023
- Imports, In Physical Terms, By Country, 2023
- Imports, In Physical Terms, By Country, 2012–2023
- Imports, In Value Terms, By Country, 2012–2023
- Import Prices, By Country Of Origin, 2012–2023
- Exports, In Physical Terms, 2012–2023
- Exports, In Value Terms, 2012–2023
- Exports, In Physical Terms, By Country, 2023
- Exports, In Physical Terms, By Country, 2012–2023
- Exports, In Value Terms, By Country, 2012–2023
- Export Prices, By Country Of Destination, 2012–2023


