Mexico - Caustic Soda - Market Analysis, Forecast, Size, Trends And Insights
Get instant access to more than 2 million reports, dashboards, and datasets on the IndexBox Platform.
View PricingOctober 2023 Sees Caustic Soda Imports in Mexico Reach $7.7M
Mexico Caustic Soda Imports
In October 2023, approximately 29K tons of caustic soda were imported into Mexico; surging by 11% compared with the previous month's figure. Over the period under review, total imports indicated a modest increase from October 2022 to October 2023: its volume increased at an average monthly rate of +1.1% over the last twelve months. The trend pattern, however, indicated some noticeable fluctuations being recorded throughout the analyzed period. Based on October 2023 figures, imports increased by +92.9% against June 2023 indices. The most prominent rate of growth was recorded in December 2022 with an increase of 75% month-to-month. Imports peaked in October 2023.
In value terms, caustic soda imports surged to $7.7M (IndexBox estimates) in October 2023. Overall, imports, however, continue to indicate a abrupt decline. The growth pace was the most rapid in July 2023 with an increase of 61% against the previous month.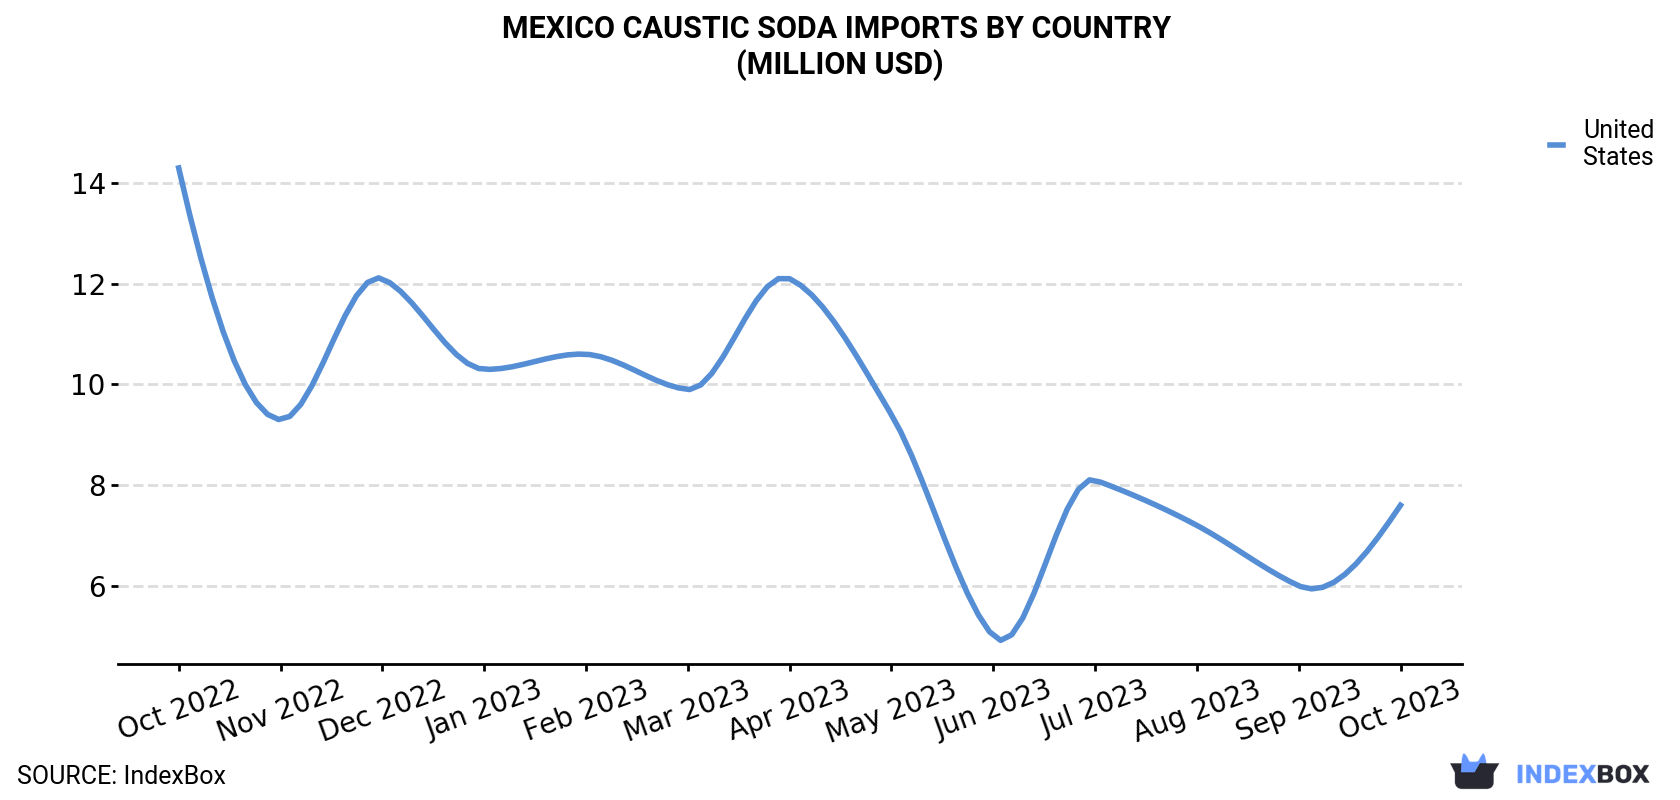
| COUNTRY | Import Value of Caustic Soda in Mexico (million USD) | ||||||||||||
|---|---|---|---|---|---|---|---|---|---|---|---|---|---|
| Oct 2022 | Nov 2022 | Dec 2022 | Jan 2023 | Feb 2023 | Mar 2023 | Apr 2023 | May 2023 | Jun 2023 | Jul 2023 | Aug 2023 | Sep 2023 | Oct 2023 | |
| United States | 14.3 | 9.3 | 12.1 | 10.3 | 10.6 | 9.9 | 12.1 | 9.4 | 5.0 | 8.1 | 7.2 | 6.0 | 7.6 |
| Others | < 0.1 | < 0.1 | N/A | < 0.1 | N/A | < 0.1 | < 0.1 | N/A | < 0.1 | < 0.1 | 0.1 | < 0.1 | < 0.1 |
| Total | 14.4 | 9.4 | 12.1 | 10.4 | 10.6 | 9.9 | 12.1 | 9.4 | 5.1 | 8.2 | 7.3 | 6.0 | 7.7 |
Imports by Country
In October 2023, the United States (29K tons) was the main supplier of caustic soda to Mexico, with a approximately 99.9% share of total imports.
From October 2022 to October 2023, the average monthly rate of growth in terms of volume from the United States stood at +1.1%.
In value terms, the United States ($7.6M) constituted the largest supplier of caustic soda to Mexico.
From October 2022 to October 2023, the average monthly rate of growth in terms of value from the United States totaled -5.1%.
Imports by Type
In October 2023, caustic soda in aqueous solution (soda lye) (29K tons) was the main type of caustic soda supplied to Mexico, with a approximately 100% share of total imports.
From October 2022 to October 2023, the average monthly rate of growth in terms of the volume of import of caustic soda in aqueous solution (soda lye) stood at +1.1%.
In value terms, caustic soda in aqueous solution (soda lye) ($7.7M) constituted the largest type of caustic soda supplied to Mexico.
Import Prices by Country
In October 2023, the caustic soda price stood at $263 per ton (CIF, Mexico), increasing by 14% against the previous month. Overall, the import price, however, continues to indicate a abrupt downturn. The pace of growth was the most pronounced in November 2022 an increase of 42% month-to-month. As a result, import price reached the peak level of $806 per ton. From December 2022 to October 2023, the average import prices failed to regain momentum.
As there is only one major supplying country, the average price level is determined by prices for the United States.
From October 2022 to October 2023, the rate of growth in terms of prices for the United States amounted to -6.2% per month.
This report provides an in-depth analysis of the caustic soda market in Mexico. Within it, you will discover the latest data on market trends and opportunities by country, consumption, production and price developments, as well as the global trade (imports and exports). The forecast exhibits the market prospects through 2030.
Product coverage:
- Prodcom 20132525 - Sodium hydroxide (caustic soda), solid
- Prodcom 20132527 - Sodium hydroxide in aqueous solution (soda lye or liquid soda)
Country coverage:
- Mexico
Data coverage:
- Market volume and value
- Per Capita consumption
- Forecast of the market dynamics in the medium term
- Trade (exports and imports) in Mexico
- Export and import prices
- Market trends, drivers and restraints
- Key market players and their profiles
Reasons to buy this report:
- Take advantage of the latest data
- Find deeper insights into current market developments
- Discover vital success factors affecting the market
This report is designed for manufacturers, distributors, importers, and wholesalers, as well as for investors, consultants and advisors.
In this report, you can find information that helps you to make informed decisions on the following issues:
- How to diversify your business and benefit from new market opportunities
- How to load your idle production capacity
- How to boost your sales on overseas markets
- How to increase your profit margins
- How to make your supply chain more sustainable
- How to reduce your production and supply chain costs
- How to outsource production to other countries
- How to prepare your business for global expansion
While doing this research, we combine the accumulated expertise of our analysts and the capabilities of artificial intelligence. The AI-based platform, developed by our data scientists, constitutes the key working tool for business analysts, empowering them to discover deep insights and ideas from the marketing data.
-
1. INTRODUCTION
Making Data-Driven Decisions to Grow Your Business
- REPORT DESCRIPTION
- RESEARCH METHODOLOGY AND AI PLATFORM
- DATA-DRIVEN DECISIONS FOR YOUR BUSINESS
- GLOSSARY AND SPECIFIC TERMS
-
2. EXECUTIVE SUMMARY
A Quick Overview of Market Performance
- KEY FINDINGS
- MARKET TRENDS This Chapter is Available Only for the Professional Edition PRO
-
3. MARKET OVERVIEW
Understanding the Current State of The Market and Its Prospects
- MARKET SIZE
- MARKET STRUCTURE
- TRADE BALANCE
- PER CAPITA CONSUMPTION
- MARKET FORECAST TO 2030
-
4. MOST PROMISING PRODUCT
Finding New Products to Diversify Your Business
This Chapter is Available Only for the Professional Edition PRO- TOP PRODUCTS TO DIVERSIFY YOUR BUSINESS
- BEST-SELLING PRODUCTS
- MOST CONSUMED PRODUCT
- MOST TRADED PRODUCT
- MOST PROFITABLE PRODUCT FOR EXPORT
-
5. MOST PROMISING SUPPLYING COUNTRIES
Choosing the Best Countries to Establish Your Sustainable Supply Chain
This Chapter is Available Only for the Professional Edition PRO- TOP COUNTRIES TO SOURCE YOUR PRODUCT
- TOP PRODUCING COUNTRIES
- TOP EXPORTING COUNTRIES
- LOW-COST EXPORTING COUNTRIES
-
6. MOST PROMISING OVERSEAS MARKETS
Choosing the Best Countries to Boost Your Exports
This Chapter is Available Only for the Professional Edition PRO- TOP OVERSEAS MARKETS FOR EXPORTING YOUR PRODUCT
- TOP CONSUMING MARKETS
- UNSATURATED MARKETS
- TOP IMPORTING MARKETS
- MOST PROFITABLE MARKETS
7. PRODUCTION
The Latest Trends and Insights into The Industry
- PRODUCTION VOLUME AND VALUE
8. IMPORTS
The Largest Import Supplying Countries
- IMPORTS FROM 2012–2023
- IMPORTS BY COUNTRY
- IMPORT PRICES BY COUNTRY
9. EXPORTS
The Largest Destinations for Exports
- EXPORTS FROM 2012–2023
- EXPORTS BY COUNTRY
- EXPORT PRICES BY COUNTRY
-
10. PROFILES OF MAJOR PRODUCERS
The Largest Producers on The Market and Their Profiles
This Chapter is Available Only for the Professional Edition PRO -
LIST OF TABLES
- Key Findings In 2023
- Market Volume, In Physical Terms, 2012–2023
- Market Value, 2012–2023
- Per Capita Consumption In 2012-2023
- Imports, In Physical Terms, By Country, 2012–2023
- Imports, In Value Terms, By Country, 2012–2023
- Import Prices, By Country Of Origin, 2012–2023
- Exports, In Physical Terms, By Country, 2012–2023
- Exports, In Value Terms, By Country, 2012–2023
- Export Prices, By Country Of Destination, 2012–2023
-
LIST OF FIGURES
- Market Volume, In Physical Terms, 2012–2023
- Market Value, 2012–2023
- Market Structure – Domestic Supply vs. Imports, In Physical Terms, 2012-2023
- Market Structure – Domestic Supply vs. Imports, In Value Terms, 2012-2023
- Trade Balance, In Physical Terms, 2012-2023
- Trade Balance, In Value Terms, 2012-2023
- Per Capita Consumption, 2012-2023
- Market Volume Forecast to 2030
- Market Value Forecast to 2030
- Products: Market Size And Growth, By Type
- Products: Average Per Capita Consumption, By Type
- Products: Exports And Growth, By Type
- Products: Export Prices And Growth, By Type
- Production Volume And Growth
- Exports And Growth
- Export Prices And Growth
- Market Size And Growth
- Per Capita Consumption
- Imports And Growth
- Import Prices
- Production, In Physical Terms, 2012–2023
- Production, In Value Terms, 2012–2023
- Imports, In Physical Terms, 2012–2023
- Imports, In Value Terms, 2012–2023
- Imports, In Physical Terms, By Country, 2023
- Imports, In Physical Terms, By Country, 2012–2023
- Imports, In Value Terms, By Country, 2012–2023
- Import Prices, By Country Of Origin, 2012–2023
- Exports, In Physical Terms, 2012–2023
- Exports, In Value Terms, 2012–2023
- Exports, In Physical Terms, By Country, 2023
- Exports, In Physical Terms, By Country, 2012–2023
- Exports, In Value Terms, By Country, 2012–2023
- Export Prices, By Country Of Destination, 2012–2023


