Hong Kong SAR, China - Paints And Varnishes - Market Analysis, Forecast, Size, Trends And Insights
Get instant access to more than 2 million reports, dashboards, and datasets on the IndexBox Platform.
View PricingSignificant Decline: Imports of Paint and Varnish Plummet to $13M in September 2023 in Hong Kong
Hong Kong Paint and Varnish Imports
For the fifth consecutive month, Hong Kong recorded growth in overseas purchases of paints and varnishes, which increased by 8.5% to 3.9K tons in September 2023. Overall, total imports indicated a pronounced increase from September 2022 to September 2023: its volume increased at an average monthly rate of +3.2% over the last twelve months. The trend pattern, however, indicated some noticeable fluctuations being recorded throughout the analyzed period. Based on September 2023 figures, imports increased by +23.2% against March 2023 indices. The pace of growth appeared the most rapid in March 2023 with an increase of 33% month-to-month. Imports peaked in September 2023.
In value terms, paint and varnish imports shrank remarkably to $13M (IndexBox estimates) in September 2023. In general, total imports indicated a modest increase from September 2022 to September 2023: its value increased at an average monthly rate of +1.3% over the last twelve months. The trend pattern, however, indicated some noticeable fluctuations being recorded throughout the analyzed period. Based on September 2023 figures, imports increased by +37.1% against May 2023 indices. The most prominent rate of growth was recorded in August 2023 with an increase of 41% m-o-m. As a result, imports attained the peak of $16M, and then shrank remarkably in the following month.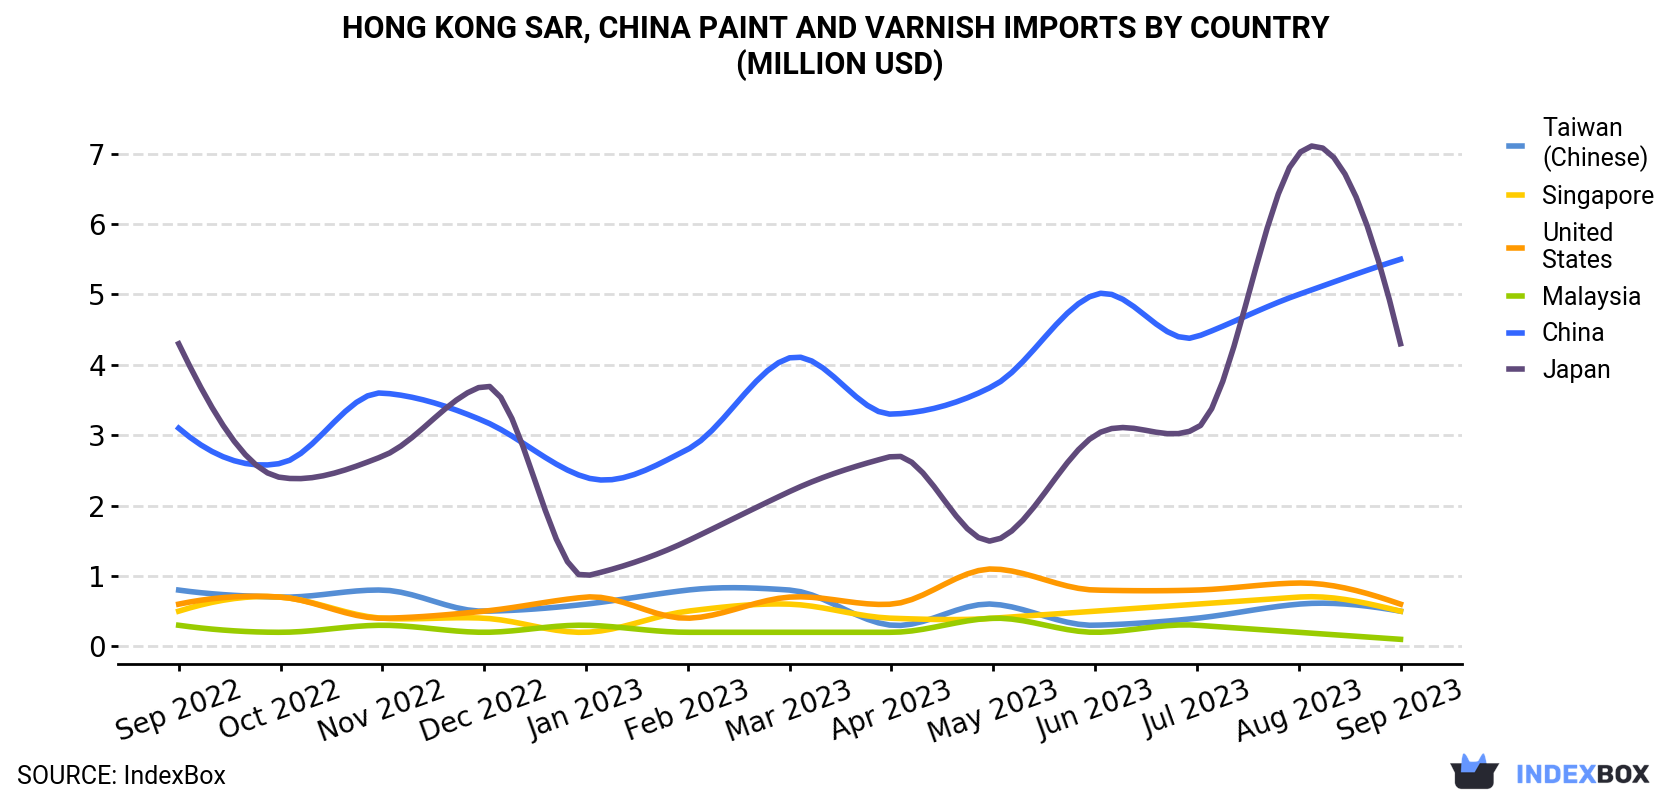
| COUNTRY | Import Value of Paint and Varnish in Hong Kong (million USD) | ||||||||||||
|---|---|---|---|---|---|---|---|---|---|---|---|---|---|
| Sep 2022 | Oct 2022 | Nov 2022 | Dec 2022 | Jan 2023 | Feb 2023 | Mar 2023 | Apr 2023 | May 2023 | Jun 2023 | Jul 2023 | Aug 2023 | Sep 2023 | |
| China | 3.1 | 2.6 | 3.6 | 3.2 | 2.4 | 2.8 | 4.1 | 3.3 | 3.7 | 5.0 | 4.4 | 5.0 | 5.5 |
| Japan | 4.3 | 2.4 | 2.7 | 3.7 | 1.0 | 1.5 | 2.2 | 2.7 | 1.5 | 3.0 | 3.1 | 7.0 | 4.3 |
| United States | 0.6 | 0.7 | 0.4 | 0.5 | 0.7 | 0.4 | 0.7 | 0.6 | 1.1 | 0.8 | 0.8 | 0.9 | 0.6 |
| Taiwan (Chinese) | 0.8 | 0.7 | 0.8 | 0.5 | 0.6 | 0.8 | 0.8 | 0.3 | 0.6 | 0.3 | 0.4 | 0.6 | 0.5 |
| Singapore | 0.5 | 0.7 | 0.4 | 0.4 | 0.2 | 0.5 | 0.6 | 0.4 | 0.4 | 0.5 | 0.6 | 0.7 | 0.5 |
| Malaysia | 0.3 | 0.2 | 0.3 | 0.2 | 0.3 | 0.2 | 0.2 | 0.2 | 0.4 | 0.2 | 0.3 | 0.2 | 0.1 |
| Others | 1.2 | 1.5 | 1.7 | 1.5 | 1.4 | 2.1 | 2.3 | 1.9 | 1.7 | 1.6 | 1.7 | 1.6 | 1.1 |
| Total | 10.8 | 8.8 | 9.9 | 10.1 | 6.5 | 8.3 | 10.9 | 9.4 | 9.3 | 11.4 | 11.4 | 16.0 | 12.7 |
Imports by Country
In September 2023, China (3K tons) constituted the largest paint and varnish supplier to Hong Kong, with a 77% share of total imports. Moreover, paint and varnish imports from China exceeded the figures recorded by the second-largest supplier, Singapore (228 tons), more than tenfold. Japan (209 tons) ranked third in terms of total imports with a 5.4% share.
From September 2022 to September 2023, the average monthly rate of growth in terms of volume from China totaled +4.3%. The remaining supplying countries recorded the following average monthly rates of imports growth: Singapore (+1.8% per month) and Japan (+5.3% per month).
In value terms, the largest paint and varnish suppliers to Hong Kong were China ($5.5M), Japan ($4.3M) and the United States ($610K), together accounting for 82% of total imports.
China, with a CAGR of +4.9%, recorded the highest growth rate of the value of imports, in terms of the main suppliers over the period under review, while purchases for the other leaders experienced a decline.
Import Prices by Country
In September 2023, the paint and varnish price stood at $3,255 per ton (CIF, Hong Kong), declining by -27% against the previous month. Overall, the import price saw a mild setback. The pace of growth appeared the most rapid in August 2023 when the average import price increased by 37% m-o-m. As a result, import price attained the peak level of $4,461 per ton, and then contracted rapidly in the following month.
There were significant differences in the average prices amongst the major supplying countries. In September 2023, the country with the highest price was Japan ($20,408 per ton), while the price for Malaysia ($1,518 per ton) was amongst the lowest.
From September 2022 to September 2023, the most notable rate of growth in terms of prices was attained by China (+0.6%), while the prices for the other major suppliers experienced a decline.
This report provides an in-depth analysis of the paint and varnish market in Hong Kong SAR, China. Within it, you will discover the latest data on market trends and opportunities by country, consumption, production and price developments, as well as the global trade (imports and exports). The forecast exhibits the market prospects through 2030.
Product coverage:
- Prodcom 20301150 - Paints and varnishes, based on acrylic or vinyl polymers dispersed or dissolved in an aqueous medium (including enamels and lacquers)
- Prodcom 20301170 - Other paints, varnishes dispersed or dissolved in an aqueous medium
- Prodcom 20301225 - Paints and varnishes, based on polyesters dispersed/dissolved in a non-aqueous medium, weight of the solvent > .50 % of the weight of the solution including enamels and lacquers
- Prodcom 20301229 - Paints and varnishes, based on polyesters dispersed/dissolved in a non-aqueous medium including enamels and lacquers excluding weight of the solvent > .50 % of the weight of the solution
- Prodcom 20301230 - Paints and varnishes, based on acrylic or vinyl polymers dispersed/dissolved in non-aqueous medium, weight of the solvent > .50 % of the solution weight including enamels and lacquers
- Prodcom 20301250 - Other paints and varnishes based on acrylic or vinyl polymers
- Prodcom 20301270 - Paints and varnishes: solutions n.e.c.
- Prodcom 20301290 - Other paints and varnishes based on synthetic polymers n.e.c.
- Prodcom 20302213 - Oil paints and varnishes (including enamels and lacquers)
- Prodcom 20302215 - Prepared water pigments for finishing leather, paints and varnishes (including enamels, lacquers and distempers) (excluding of oil)
Country coverage:
- Hong Kong SAR
Data coverage:
- Market volume and value
- Per Capita consumption
- Forecast of the market dynamics in the medium term
- Trade (exports and imports) in Hong Kong SAR, China
- Export and import prices
- Market trends, drivers and restraints
- Key market players and their profiles
Reasons to buy this report:
- Take advantage of the latest data
- Find deeper insights into current market developments
- Discover vital success factors affecting the market
This report is designed for manufacturers, distributors, importers, and wholesalers, as well as for investors, consultants and advisors.
In this report, you can find information that helps you to make informed decisions on the following issues:
- How to diversify your business and benefit from new market opportunities
- How to load your idle production capacity
- How to boost your sales on overseas markets
- How to increase your profit margins
- How to make your supply chain more sustainable
- How to reduce your production and supply chain costs
- How to outsource production to other countries
- How to prepare your business for global expansion
While doing this research, we combine the accumulated expertise of our analysts and the capabilities of artificial intelligence. The AI-based platform, developed by our data scientists, constitutes the key working tool for business analysts, empowering them to discover deep insights and ideas from the marketing data.
-
1. INTRODUCTION
Making Data-Driven Decisions to Grow Your Business
- REPORT DESCRIPTION
- RESEARCH METHODOLOGY AND AI PLATFORM
- DATA-DRIVEN DECISIONS FOR YOUR BUSINESS
- GLOSSARY AND SPECIFIC TERMS
-
2. EXECUTIVE SUMMARY
A Quick Overview of Market Performance
- KEY FINDINGS
- MARKET TRENDS This Chapter is Available Only for the Professional Edition PRO
-
3. MARKET OVERVIEW
Understanding the Current State of The Market and Its Prospects
- MARKET SIZE
- MARKET STRUCTURE
- TRADE BALANCE
- PER CAPITA CONSUMPTION
- MARKET FORECAST TO 2030
-
4. MOST PROMISING PRODUCT
Finding New Products to Diversify Your Business
This Chapter is Available Only for the Professional Edition PRO- TOP PRODUCTS TO DIVERSIFY YOUR BUSINESS
- BEST-SELLING PRODUCTS
- MOST CONSUMED PRODUCT
- MOST TRADED PRODUCT
- MOST PROFITABLE PRODUCT FOR EXPORT
-
5. MOST PROMISING SUPPLYING COUNTRIES
Choosing the Best Countries to Establish Your Sustainable Supply Chain
This Chapter is Available Only for the Professional Edition PRO- TOP COUNTRIES TO SOURCE YOUR PRODUCT
- TOP PRODUCING COUNTRIES
- TOP EXPORTING COUNTRIES
- LOW-COST EXPORTING COUNTRIES
-
6. MOST PROMISING OVERSEAS MARKETS
Choosing the Best Countries to Boost Your Exports
This Chapter is Available Only for the Professional Edition PRO- TOP OVERSEAS MARKETS FOR EXPORTING YOUR PRODUCT
- TOP CONSUMING MARKETS
- UNSATURATED MARKETS
- TOP IMPORTING MARKETS
- MOST PROFITABLE MARKETS
7. PRODUCTION
The Latest Trends and Insights into The Industry
- PRODUCTION VOLUME AND VALUE
8. IMPORTS
The Largest Import Supplying Countries
- IMPORTS FROM 2012–2023
- IMPORTS BY COUNTRY
- IMPORT PRICES BY COUNTRY
9. EXPORTS
The Largest Destinations for Exports
- EXPORTS FROM 2012–2023
- EXPORTS BY COUNTRY
- EXPORT PRICES BY COUNTRY
-
10. PROFILES OF MAJOR PRODUCERS
The Largest Producers on The Market and Their Profiles
This Chapter is Available Only for the Professional Edition PRO -
LIST OF TABLES
- Key Findings In 2023
- Market Volume, In Physical Terms, 2012–2023
- Market Value, 2012–2023
- Per Capita Consumption In 2012-2023
- Imports, In Physical Terms, By Country, 2012–2023
- Imports, In Value Terms, By Country, 2012–2023
- Import Prices, By Country Of Origin, 2012–2023
- Exports, In Physical Terms, By Country, 2012–2023
- Exports, In Value Terms, By Country, 2012–2023
- Export Prices, By Country Of Destination, 2012–2023
-
LIST OF FIGURES
- Market Volume, In Physical Terms, 2012–2023
- Market Value, 2012–2023
- Market Structure – Domestic Supply vs. Imports, In Physical Terms, 2012-2023
- Market Structure – Domestic Supply vs. Imports, In Value Terms, 2012-2023
- Trade Balance, In Physical Terms, 2012-2023
- Trade Balance, In Value Terms, 2012-2023
- Per Capita Consumption, 2012-2023
- Market Volume Forecast to 2030
- Market Value Forecast to 2030
- Products: Market Size And Growth, By Type
- Products: Average Per Capita Consumption, By Type
- Products: Exports And Growth, By Type
- Products: Export Prices And Growth, By Type
- Production Volume And Growth
- Exports And Growth
- Export Prices And Growth
- Market Size And Growth
- Per Capita Consumption
- Imports And Growth
- Import Prices
- Production, In Physical Terms, 2012–2023
- Production, In Value Terms, 2012–2023
- Imports, In Physical Terms, 2012–2023
- Imports, In Value Terms, 2012–2023
- Imports, In Physical Terms, By Country, 2023
- Imports, In Physical Terms, By Country, 2012–2023
- Imports, In Value Terms, By Country, 2012–2023
- Import Prices, By Country Of Origin, 2012–2023
- Exports, In Physical Terms, 2012–2023
- Exports, In Value Terms, 2012–2023
- Exports, In Physical Terms, By Country, 2023
- Exports, In Physical Terms, By Country, 2012–2023
- Exports, In Value Terms, By Country, 2012–2023
- Export Prices, By Country Of Destination, 2012–2023


