
Canada - Rapeseed Oil - Market Analysis, Forecast, Size, Trends and Insights
Get instant access to more than 2 million reports, dashboards, and datasets on the IndexBox Platform.
View PricingDecline in Canada's June 2023 Rapeseed Oil Export Valued at $316M
Canada Rapeseed Oil Exports
Rapeseed oil exports from Canada contracted rapidly to 199K tons in June 2023, dropping by -26.2% compared with the month before. Overall, exports, however, recorded a relatively flat trend pattern. The growth pace was the most rapid in October 2022 when exports increased by 52% m-o-m.
In value terms, rapeseed oil exports plummeted to $316M (IndexBox estimates) in June 2023. In general, exports continue to indicate a slight decline. The most prominent rate of growth was recorded in October 2022 when exports increased by 42% against the previous month. 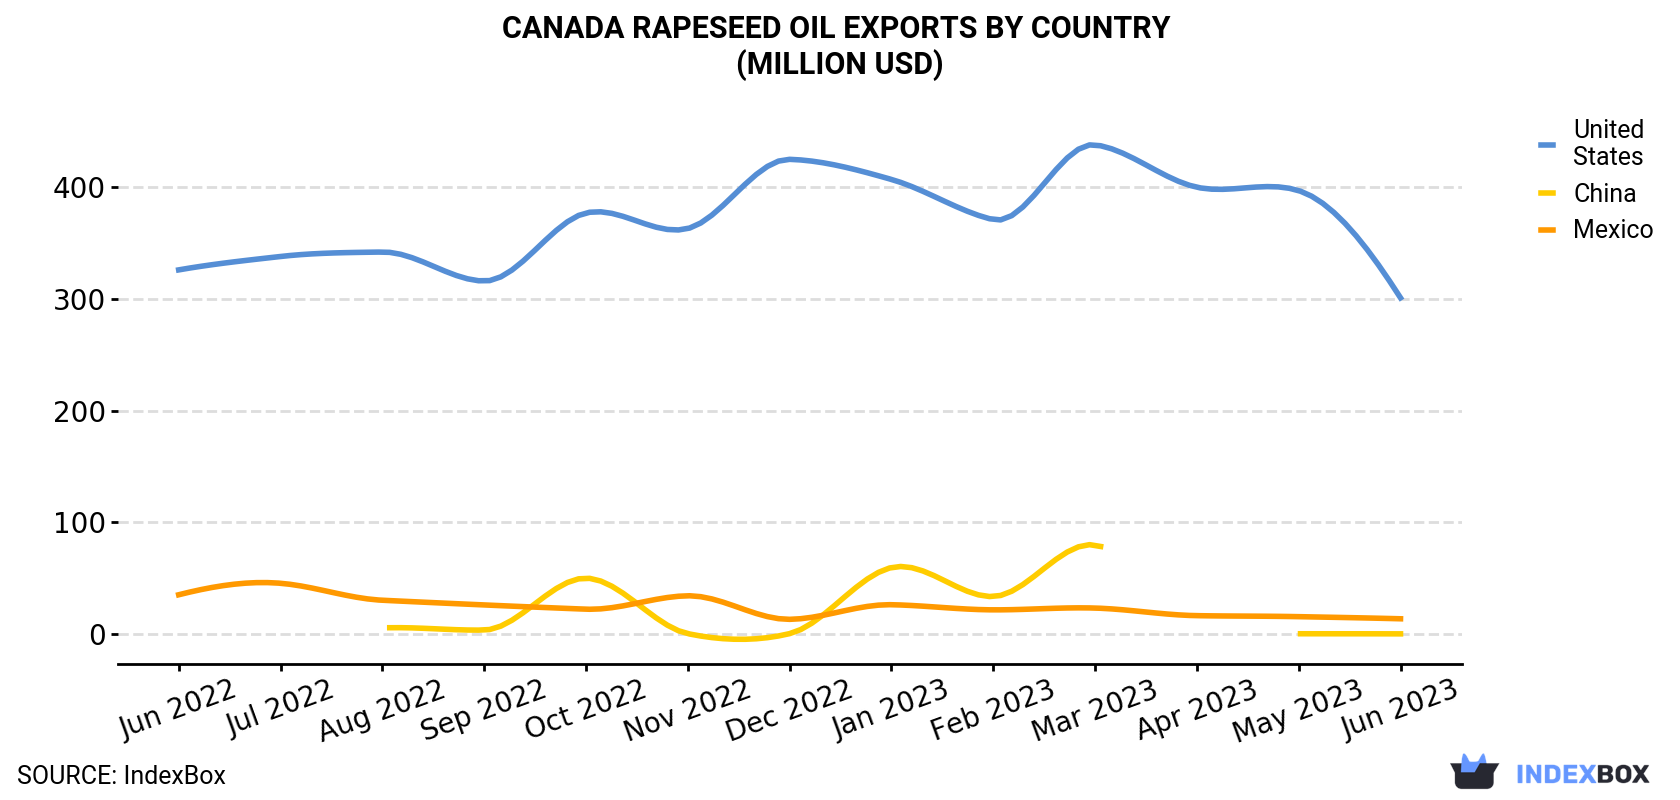
| COUNTRY | Export Value of Rapeseed Oil in Canada (million USD) | ||||||||||||
|---|---|---|---|---|---|---|---|---|---|---|---|---|---|
| Jun 2022 | Jul 2022 | Aug 2022 | Sep 2022 | Oct 2022 | Nov 2022 | Dec 2022 | Jan 2023 | Feb 2023 | Mar 2023 | Apr 2023 | May 2023 | Jun 2023 | |
| United States | 326 | 338 | 342 | 316 | 377 | 363 | 425 | 407 | 371 | 438 | 400 | 397 | 301 |
| Mexico | 35.1 | 45.4 | 30.2 | 26.0 | 22.2 | 34.2 | 13.1 | 26.2 | 21.6 | 23.2 | 16.4 | 15.5 | 13.6 |
| China | 10.7 | < 0.1 | 5.4 | 3.5 | 50.0 | 0.3 | 0.3 | 59.5 | 33.5 | 79.7 | < 0.1 | 0.2 | 0.1 |
| Others | 23.5 | 43.6 | 25.1 | 12.1 | 59.5 | 15.7 | 15.1 | 5.2 | 23.1 | 9.1 | 18.7 | 7.6 | 1.4 |
| Total | 395 | 427 | 402 | 357 | 509 | 414 | 454 | 498 | 450 | 550 | 435 | 420 | 316 |
Exports by Country
The United States (190K tons) was the main destination for rapeseed oil exports from Canada, with a 96% share of total exports. Moreover, rapeseed oil exports to the United States exceeded the volume sent to the second major destination, Mexico (7.7K tons), more than tenfold.
From June 2022 to June 2023, the average monthly growth rate of volume to the United States totaled +1.7%. Exports to the other major destinations recorded the following average monthly rates of exports growth: Mexico (-6.7% per month) and China (-28.8% per month).
In value terms, the United States ($301M) remains the key foreign market for rapeseed oil exports from Canada, comprising 95% of total exports. The second position in the ranking was held by Mexico ($14M), with a 4.3% share of total exports.
From June 2022 to June 2023, the average monthly growth rate of value to the United States was relatively modest. Exports to the other major destinations recorded the following average monthly rates of exports growth: Mexico (-7.6% per month) and China (-30.1% per month).
Exports by Type
Vegetable oils; low erucic acid rape or colza oil and its fractions, other than crude, but not chemically modified (136K tons) was the largest type of rapeseed oil exported from Canada, with a 68% share of total exports. Moreover, vegetable oils; low erucic acid rape or colza oil and its fractions, other than crude, but not chemically modified exceeded the volume of the second product type, vegetable oils; low erucic acid rape or colza oil and its fractions, crude (55K tons), twofold. Vegetable oils; excluding low erucic acid rape or colza oil and its fractions, crude (7.6K tons) ranked third in terms of total exports with a 3.8% share.
From June 2022 to June 2023, the average monthly rate of growth in terms of the volume of export of vegetable oils; low erucic acid rape or colza oil and its fractions, other than crude, but not chemically modified was relatively modest. With regard to the other exported products, the following average monthly rates of growth were recorded: vegetable oils; low erucic acid rape or colza oil and its fractions, crude (+0.1% per month) and vegetable oils; excluding low erucic acid rape or colza oil and its fractions, crude (+13.9% per month).
In value terms, vegetable oils; low erucic acid rape or colza oil and its fractions, other than crude, but not chemically modified ($231M) remains the largest type of rapeseed oil exported from Canada, comprising 73% of total exports. The second position in the ranking was held by vegetable oils; low erucic acid rape or colza oil and its fractions, crude ($75M), with a 24% share of total exports. It was followed by vegetable oils; excluding low erucic acid rape or colza oil and its fractions, crude, with a 3.4% share.
From June 2022 to June 2023, the average monthly growth rate of the export volume of vegetable oils; low erucic acid rape or colza oil and its fractions, other than crude, but not chemically modified amounted to -1.9%. With regard to the other exported products, the following average monthly rates of growth were recorded: vegetable oils; low erucic acid rape or colza oil and its fractions, crude (-2.5% per month) and vegetable oils; excluding low erucic acid rape or colza oil and its fractions, crude (+12.0% per month).
Export Prices by Country
In June 2023, the rapeseed oil price stood at $1,593 per ton (FOB, Canada), with an increase of 2.1% against the previous month. Over the period under review, the export price, however, showed a pronounced setback. The pace of growth appeared the most rapid in March 2023 an increase of 4.5% against the previous month. The export price peaked at $2,048 per ton in June 2022; however, from July 2022 to June 2023, the export prices stood at a somewhat lower figure.
Average prices varied noticeably for the major overseas markets. In June 2023, the country with the highest price was Mexico ($1,771 per ton), while the average price for exports to China ($1,488 per ton) was amongst the lowest.
From June 2022 to June 2023, the most notable rate of growth in terms of prices was recorded for supplies to Mexico (-1.0%), while the prices for the other major destinations experienced a decline.
This report provides an in-depth analysis of the rapeseed oil market in Canada. Within it, you will discover the latest data on market trends and opportunities by country, consumption, production and price developments, as well as the global trade (imports and exports). The forecast exhibits the market prospects through 2030.
Product coverage:
- FCL 271 - Oil of Rapeseed or Canola oil
Country coverage:
- Canada
Data coverage:
- Market volume and value
- Per Capita consumption
- Forecast of the market dynamics in the medium term
- Trade (exports and imports) in Canada
- Export and import prices
- Market trends, drivers and restraints
- Key market players and their profiles
Reasons to buy this report:
- Take advantage of the latest data
- Find deeper insights into current market developments
- Discover vital success factors affecting the market
This report is designed for manufacturers, distributors, importers, and wholesalers, as well as for investors, consultants and advisors.
In this report, you can find information that helps you to make informed decisions on the following issues:
- How to diversify your business and benefit from new market opportunities
- How to load your idle production capacity
- How to boost your sales on overseas markets
- How to increase your profit margins
- How to make your supply chain more sustainable
- How to reduce your production and supply chain costs
- How to outsource production to other countries
- How to prepare your business for global expansion
While doing this research, we combine the accumulated expertise of our analysts and the capabilities of artificial intelligence. The AI-based platform, developed by our data scientists, constitutes the key working tool for business analysts, empowering them to discover deep insights and ideas from the marketing data.
-
1. INTRODUCTION
Making Data-Driven Decisions to Grow Your Business
- REPORT DESCRIPTION
- RESEARCH METHODOLOGY AND AI PLATFORM
- DATA-DRIVEN DECISIONS FOR YOUR BUSINESS
- GLOSSARY AND SPECIFIC TERMS
-
2. EXECUTIVE SUMMARY
A Quick Overview of Market Performance
- KEY FINDINGS
- MARKET TRENDS This Chapter is Available Only for the Professional Edition PRO
-
3. MARKET OVERVIEW
Understanding the Current State of The Market and Its Prospects
- MARKET SIZE
- MARKET STRUCTURE
- TRADE BALANCE
- PER CAPITA CONSUMPTION
- MARKET FORECAST TO 2030
-
4. MOST PROMISING PRODUCT
Finding New Products to Diversify Your Business
This Chapter is Available Only for the Professional Edition PRO- TOP PRODUCTS TO DIVERSIFY YOUR BUSINESS
- BEST-SELLING PRODUCTS
- MOST CONSUMED PRODUCT
- MOST TRADED PRODUCT
- MOST PROFITABLE PRODUCT FOR EXPORT
-
5. MOST PROMISING SUPPLYING COUNTRIES
Choosing the Best Countries to Establish Your Sustainable Supply Chain
This Chapter is Available Only for the Professional Edition PRO- TOP COUNTRIES TO SOURCE YOUR PRODUCT
- TOP PRODUCING COUNTRIES
- TOP EXPORTING COUNTRIES
- LOW-COST EXPORTING COUNTRIES
-
6. MOST PROMISING OVERSEAS MARKETS
Choosing the Best Countries to Boost Your Exports
This Chapter is Available Only for the Professional Edition PRO- TOP OVERSEAS MARKETS FOR EXPORTING YOUR PRODUCT
- TOP CONSUMING MARKETS
- UNSATURATED MARKETS
- TOP IMPORTING MARKETS
- MOST PROFITABLE MARKETS
7. PRODUCTION
The Latest Trends and Insights into The Industry
- PRODUCTION VOLUME AND VALUE
8. IMPORTS
The Largest Import Supplying Countries
- IMPORTS FROM 2012–2023
- IMPORTS BY COUNTRY
- IMPORT PRICES BY COUNTRY
9. EXPORTS
The Largest Destinations for Exports
- EXPORTS FROM 2012–2023
- EXPORTS BY COUNTRY
- EXPORT PRICES BY COUNTRY
-
10. PROFILES OF MAJOR PRODUCERS
The Largest Producers on The Market and Their Profiles
This Chapter is Available Only for the Professional Edition PRO -
LIST OF TABLES
- Key Findings In 2023
- Market Volume, In Physical Terms, 2012–2023
- Market Value, 2012–2023
- Per Capita Consumption In 2012-2023
- Imports, In Physical Terms, By Country, 2012–2023
- Imports, In Value Terms, By Country, 2012–2023
- Import Prices, By Country Of Origin, 2012–2023
- Exports, In Physical Terms, By Country, 2012–2023
- Exports, In Value Terms, By Country, 2012–2023
- Export Prices, By Country Of Destination, 2012–2023
-
LIST OF FIGURES
- Market Volume, In Physical Terms, 2012–2023
- Market Value, 2012–2023
- Market Structure – Domestic Supply vs. Imports, In Physical Terms, 2012-2023
- Market Structure – Domestic Supply vs. Imports, In Value Terms, 2012-2023
- Trade Balance, In Physical Terms, 2012-2023
- Trade Balance, In Value Terms, 2012-2023
- Per Capita Consumption, 2012-2023
- Market Volume Forecast to 2030
- Market Value Forecast to 2030
- Products: Market Size And Growth, By Type
- Products: Average Per Capita Consumption, By Type
- Products: Exports And Growth, By Type
- Products: Export Prices And Growth, By Type
- Production Volume And Growth
- Exports And Growth
- Export Prices And Growth
- Market Size And Growth
- Per Capita Consumption
- Imports And Growth
- Import Prices
- Production, In Physical Terms, 2012–2023
- Production, In Value Terms, 2012–2023
- Imports, In Physical Terms, 2012–2023
- Imports, In Value Terms, 2012–2023
- Imports, In Physical Terms, By Country, 2023
- Imports, In Physical Terms, By Country, 2012–2023
- Imports, In Value Terms, By Country, 2012–2023
- Import Prices, By Country Of Origin, 2012–2023
- Exports, In Physical Terms, 2012–2023
- Exports, In Value Terms, 2012–2023
- Exports, In Physical Terms, By Country, 2023
- Exports, In Physical Terms, By Country, 2012–2023
- Exports, In Value Terms, By Country, 2012–2023
- Export Prices, By Country Of Destination, 2012–2023


