Canada - Potassic Fertilizers (Mineral And Chemical) - Market Analysis, Forecast, Size, Trends and Insights
Get instant access to more than 2 million reports, dashboards, and datasets on the IndexBox Platform.
View PricingExport of Potassic Fertilizer Surges to $663M in Canada in October 2023
Canada Potassic Fertilizer Exports
In October 2023, the amount of potassic fertilizers exported from Canada surged to 2.3M tons, jumping by 17% on September 2023 figures. Overall, total exports indicated perceptible growth from October 2022 to October 2023: its volume increased at an average monthly rate of +2.6% over the last twelve months. The trend pattern, however, indicated some noticeable fluctuations being recorded throughout the analyzed period. Based on October 2023 figures, exports increased by +63.6% against July 2023 indices. The growth pace was the most rapid in August 2023 when exports increased by 44% month-to-month. The exports peaked in October 2023.
In value terms, potassic fertilizer exports skyrocketed to $663M (IndexBox estimates) in October 2023. Over the period under review, exports, however, showed a noticeable setback. The most prominent rate of growth was recorded in August 2023 when exports increased by 34% against the previous month.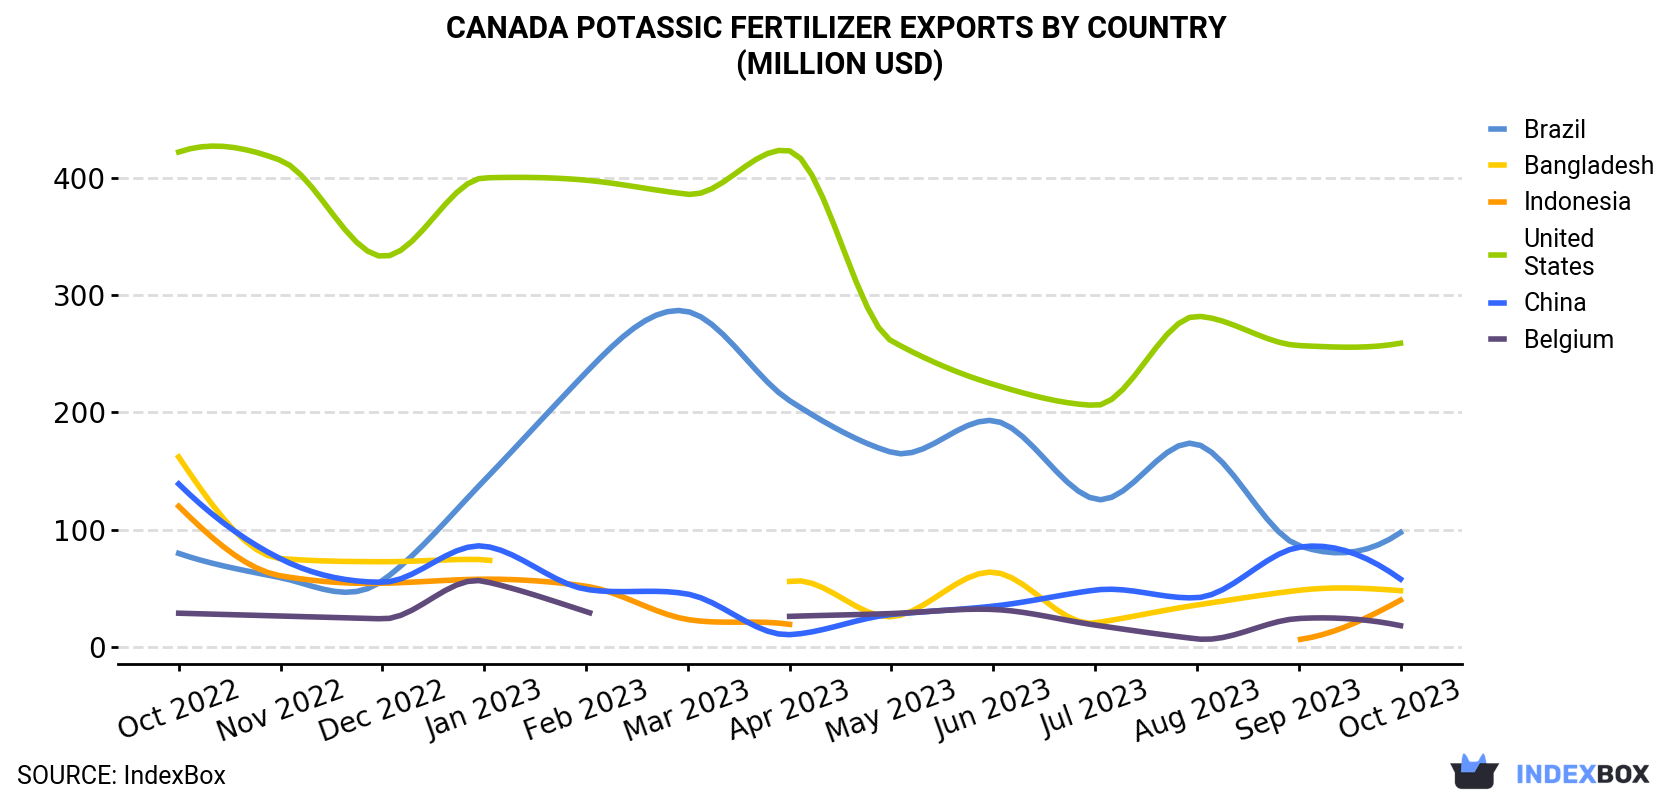
| COUNTRY | Export Value of Potassic Fertilizer in Canada (million USD) | ||||||||||||
|---|---|---|---|---|---|---|---|---|---|---|---|---|---|
| Oct 2022 | Nov 2022 | Dec 2022 | Jan 2023 | Feb 2023 | Mar 2023 | Apr 2023 | May 2023 | Jun 2023 | Jul 2023 | Aug 2023 | Sep 2023 | Oct 2023 | |
| United States | 422 | 415 | 333 | 400 | 398 | 386 | 423 | 261 | 224 | 206 | 282 | 257 | 259 |
| Brazil | 79.8 | 59.1 | 56.5 | 142 | 234 | 286 | 210 | 166 | 193 | 126 | 173 | 86.5 | 97.6 |
| China | 139 | 75.2 | 55.2 | 86.0 | 49.2 | 45.1 | 10.5 | 27.7 | 34.8 | 48.5 | 42.0 | 85.0 | 57.9 |
| Bangladesh | 162 | 75.4 | 72.7 | 74.5 | N/A | N/A | 55.9 | 25.8 | 63.8 | 20.5 | 35.8 | 48.3 | 48.0 |
| Indonesia | 120 | 60.7 | 54.3 | 57.8 | 51.8 | 23.4 | 19.3 | N/A | N/A | N/A | N/A | 6.3 | 39.9 |
| Belgium | 28.8 | 26.4 | 24.0 | 56.0 | 30.2 | N/A | 26.1 | 28.5 | 32.0 | 18.7 | 6.9 | 24.3 | 18.2 |
| Others | 175 | 237 | 185 | 64.4 | 97.4 | 184 | 141 | 193 | 164 | 72.9 | 119 | 64.3 | 142 |
| Total | 1,127 | 949 | 780 | 881 | 861 | 925 | 886 | 703 | 712 | 493 | 658 | 572 | 663 |
Exports by Country
The United States (951K tons) was the main destination for potassic fertilizer exports from Canada, accounting for a 41% share of total exports. Moreover, potassic fertilizer exports to the United States exceeded the volume sent to the second major destination, Brazil (326K tons), threefold. The third position in this ranking was taken by China (196K tons), with an 8.5% share.
From October 2022 to October 2023, the average monthly growth rate of volume to the United States stood at +2.4%. Exports to the other major destinations recorded the following average monthly rates of exports growth: Brazil (+9.6% per month) and China (-1.2% per month).
In value terms, the United States ($259M) remains the key foreign market for potassic fertilizer exports from Canada, comprising 39% of total exports. The second position in the ranking was taken by Brazil ($98M), with a 15% share of total exports. It was followed by China, with an 8.7% share.
From October 2022 to October 2023, the average monthly rate of growth in terms of value to the United States amounted to -4.0%. Exports to the other major destinations recorded the following average monthly rates of exports growth: Brazil (+1.7% per month) and China (-7.0% per month).
Exports by Type
Potassium chloride (MOP) (2.3M tons) was the largest type of potassic fertilizer exported from Canada, with a 100% share of total exports. It was followed by potassium sulphate (SOP) (2.5K tons), with a 0.1% share of total exports.
From October 2022 to October 2023, the average monthly rate of growth in terms of the volume of export of potassium chloride (MOP) totaled +2.6%.
In value terms, potassium chloride (MOP) ($661M) remains the largest type of potassic fertilizer exported from Canada, comprising 100% of total exports. The second position in the ranking was taken by potassium sulphate (SOP) ($2.3M), with a 0.3% share of total exports.
From October 2022 to October 2023, the average monthly rate of growth in terms of the export volume of potassium chloride (MOP) totaled -4.3%.
Export Prices by Country
In October 2023, the potassic fertilizer price stood at $287 per ton (FOB, Canada), approximately mirroring the previous month. Overall, the export price continues to indicate a abrupt curtailment. The pace of growth appeared the most rapid in January 2023 an increase of 0.1% against the previous month. Over the period under review, the average export prices attained the maximum at $661 per ton in October 2022; however, from November 2022 to October 2023, the export prices remained at a lower figure.
Average prices varied noticeably for the major overseas markets. In October 2023, the highest price was recorded for prices to Thailand ($306 per ton) and Brazil ($300 per ton), while the average price for exports to the United States ($273 per ton) and Belgium ($294 per ton) were amongst the lowest.
From October 2022 to October 2023, the most notable rate of growth in terms of prices was recorded for supplies to China (-5.9%), while the prices for the other major destinations experienced a decline.
This report provides an in-depth analysis of the potassic fertilizer market in Canada. Within it, you will discover the latest data on market trends and opportunities by country, consumption, production and price developments, as well as the global trade (imports and exports). The forecast exhibits the market prospects through 2030.
Product coverage:
- FCL 4016 - Potassium chloride (muriate of potash) (MOP)
- FCL 4017 - Potassium sulphate (sulphate of potash) (SOP)
Country coverage:
- Canada
Data coverage:
- Market volume and value
- Per Capita consumption
- Forecast of the market dynamics in the medium term
- Trade (exports and imports) in Canada
- Export and import prices
- Market trends, drivers and restraints
- Key market players and their profiles
Reasons to buy this report:
- Take advantage of the latest data
- Find deeper insights into current market developments
- Discover vital success factors affecting the market
This report is designed for manufacturers, distributors, importers, and wholesalers, as well as for investors, consultants and advisors.
In this report, you can find information that helps you to make informed decisions on the following issues:
- How to diversify your business and benefit from new market opportunities
- How to load your idle production capacity
- How to boost your sales on overseas markets
- How to increase your profit margins
- How to make your supply chain more sustainable
- How to reduce your production and supply chain costs
- How to outsource production to other countries
- How to prepare your business for global expansion
While doing this research, we combine the accumulated expertise of our analysts and the capabilities of artificial intelligence. The AI-based platform, developed by our data scientists, constitutes the key working tool for business analysts, empowering them to discover deep insights and ideas from the marketing data.
-
1. INTRODUCTION
Making Data-Driven Decisions to Grow Your Business
- REPORT DESCRIPTION
- RESEARCH METHODOLOGY AND AI PLATFORM
- DATA-DRIVEN DECISIONS FOR YOUR BUSINESS
- GLOSSARY AND SPECIFIC TERMS
-
2. EXECUTIVE SUMMARY
A Quick Overview of Market Performance
- KEY FINDINGS
- MARKET TRENDS This Chapter is Available Only for the Professional Edition PRO
-
3. MARKET OVERVIEW
Understanding the Current State of The Market and Its Prospects
- MARKET SIZE
- MARKET STRUCTURE
- TRADE BALANCE
- PER CAPITA CONSUMPTION
- MARKET FORECAST TO 2030
-
4. MOST PROMISING PRODUCT
Finding New Products to Diversify Your Business
This Chapter is Available Only for the Professional Edition PRO- TOP PRODUCTS TO DIVERSIFY YOUR BUSINESS
- BEST-SELLING PRODUCTS
- MOST CONSUMED PRODUCT
- MOST TRADED PRODUCT
- MOST PROFITABLE PRODUCT FOR EXPORT
-
5. MOST PROMISING SUPPLYING COUNTRIES
Choosing the Best Countries to Establish Your Sustainable Supply Chain
This Chapter is Available Only for the Professional Edition PRO- TOP COUNTRIES TO SOURCE YOUR PRODUCT
- TOP PRODUCING COUNTRIES
- TOP EXPORTING COUNTRIES
- LOW-COST EXPORTING COUNTRIES
-
6. MOST PROMISING OVERSEAS MARKETS
Choosing the Best Countries to Boost Your Exports
This Chapter is Available Only for the Professional Edition PRO- TOP OVERSEAS MARKETS FOR EXPORTING YOUR PRODUCT
- TOP CONSUMING MARKETS
- UNSATURATED MARKETS
- TOP IMPORTING MARKETS
- MOST PROFITABLE MARKETS
7. PRODUCTION
The Latest Trends and Insights into The Industry
- PRODUCTION VOLUME AND VALUE
8. IMPORTS
The Largest Import Supplying Countries
- IMPORTS FROM 2012–2023
- IMPORTS BY COUNTRY
- IMPORT PRICES BY COUNTRY
9. EXPORTS
The Largest Destinations for Exports
- EXPORTS FROM 2012–2023
- EXPORTS BY COUNTRY
- EXPORT PRICES BY COUNTRY
-
10. PROFILES OF MAJOR PRODUCERS
The Largest Producers on The Market and Their Profiles
This Chapter is Available Only for the Professional Edition PRO -
LIST OF TABLES
- Key Findings In 2023
- Market Volume, In Physical Terms, 2012–2023
- Market Value, 2012–2023
- Per Capita Consumption In 2012-2023
- Imports, In Physical Terms, By Country, 2012–2023
- Imports, In Value Terms, By Country, 2012–2023
- Import Prices, By Country Of Origin, 2012–2023
- Exports, In Physical Terms, By Country, 2012–2023
- Exports, In Value Terms, By Country, 2012–2023
- Export Prices, By Country Of Destination, 2012–2023
-
LIST OF FIGURES
- Market Volume, In Physical Terms, 2012–2023
- Market Value, 2012–2023
- Market Structure – Domestic Supply vs. Imports, In Physical Terms, 2012-2023
- Market Structure – Domestic Supply vs. Imports, In Value Terms, 2012-2023
- Trade Balance, In Physical Terms, 2012-2023
- Trade Balance, In Value Terms, 2012-2023
- Per Capita Consumption, 2012-2023
- Market Volume Forecast to 2030
- Market Value Forecast to 2030
- Products: Market Size And Growth, By Type
- Products: Average Per Capita Consumption, By Type
- Products: Exports And Growth, By Type
- Products: Export Prices And Growth, By Type
- Production Volume And Growth
- Exports And Growth
- Export Prices And Growth
- Market Size And Growth
- Per Capita Consumption
- Imports And Growth
- Import Prices
- Production, In Physical Terms, 2012–2023
- Production, In Value Terms, 2012–2023
- Imports, In Physical Terms, 2012–2023
- Imports, In Value Terms, 2012–2023
- Imports, In Physical Terms, By Country, 2023
- Imports, In Physical Terms, By Country, 2012–2023
- Imports, In Value Terms, By Country, 2012–2023
- Import Prices, By Country Of Origin, 2012–2023
- Exports, In Physical Terms, 2012–2023
- Exports, In Value Terms, 2012–2023
- Exports, In Physical Terms, By Country, 2023
- Exports, In Physical Terms, By Country, 2012–2023
- Exports, In Value Terms, By Country, 2012–2023
- Export Prices, By Country Of Destination, 2012–2023


